
ETH Buy Zone Signals Cautious Market Shift
ETH Buy Zone signals are emerging as Ether’s market structure weakens following a nearly 20 percent November decline. Ether has dropped from around 3900 to retest the key 3000 level, marking the first revisit of that price since mid-July. This sharp pullback places ETH in a technically fragile daily downtrend, defined by lower highs and lower lows, yet several long-term accumulation indicators point toward conditions that historically preceded market bottoms. The combination of weakening short-term structure and strengthening long-term signals has created a mixed environment in which investors are watching closely while many traders are remaining cautious.
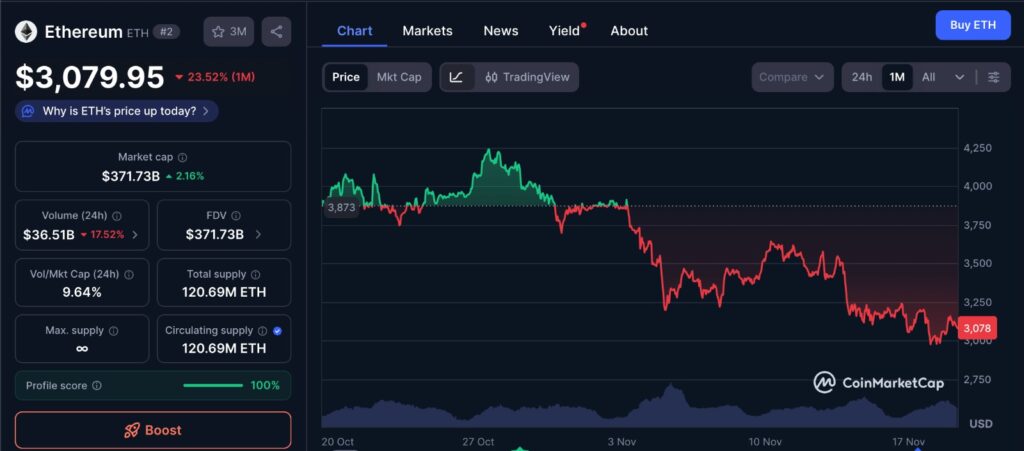
The one-month ETH chart shown above highlights the recent shift in market momentum, reflecting the broader decline that pushed Ether back toward the key 3,000 region. The gradual downtrend is visible through a series of lower highs and lower lows, consistent with the broader weakness discussed in this analysis. Despite this pullback, the chart also illustrates periods of short-lived rebounds, showing that buyers are still active even as volatility remains elevated. This visual snapshot reinforces the ongoing tension between long-term accumulation signals and short-term uncertainty in the market.
ETH Buy Zone and the November Downtrend
The ETH Buy Zone is being discussed heavily because Ether’s continued decline has pushed it into an area where long-term metrics suggest discounted value. With ETH sliding almost 20 percent through the month, the market is now testing levels typically associated with early-cycle resets rather than deeper structural breakdowns. The return to 3000 on November 17 marked the lowest level since July 15, underscoring the speed and depth of the current correction.
Despite this drop, the broader market still pays close attention to historical accumulation signals. Ether’s daily chart reflects a clear downtrend, but this trend does not automatically negate the possibility that ETH is entering a zone where long-term investors begin to accumulate positions. The appearance of these signals helps explain why analysts remain attentive even as volatility persists.
The Mayer Multiple Supports the ETH Buy Zone Thesis
A key factor driving the discussion around the ETH Buy Zone is the Mayer Multiple, a metric created by Capriole Investments. The Mayer Multiple measures the relationship between the current price of ETH and its 200-day moving average. When the ratio falls below 1, it indicates that Ether is trading at a discount relative to its long-term trend. This type of reading has historically been aligned with major accumulation phases.
ETH’s Mayer Multiple recently dropped below 1 for the first time since mid-June. This shift places ETH back into what analysts refer to as the buy zone. Throughout Ether’s history, sub-1 readings have generally signaled that long-term bottoms or recovery phases may be forming. The most notable exception was January 2022, when broader market conditions pushed prices into a prolonged bear trend despite the Mayer Multiple’s discounted reading.
Market observers note that current Mayer Multiple levels resemble early-cycle resets rather than the deeper structural damage of 2022. This places the present market closer to historical growth setups than to distribution phases, which typically occur when the Mayer Multiple rises above 2.4. Although the indicator does not predict immediate reversals, it does suggest favorable accumulation conditions for long-term investors.
Liquidity Structure Resets but Still Contains Risks
Even with the ETH Buy Zone supported by long-term metrics, short-term market conditions remain unstable. Data from Hyblock Capital indicates that ETH sits above several dense long-liquidation clusters even after sweeping the 3000 psychological level. Hyblock notes that the next major clusters lie between 2904 and 2916, and again between 2760 and 2772. These clusters represent areas where leveraged traders may be forced into liquidation if the price moves downward, creating potential volatility spikes.
Analysts at Hyblock suggest the market may need a deeper liquidity flush before forming a strong foundation. These clusters act as magnets that price may revisit, especially during periods of high leverage and weak trend structure.
Adding to this outlook, the analytics platform Altcoin Vector reports that Ether’s overall liquidity structure has fully reset. Each major ETH bottom throughout its history has occurred after a full liquidity reset, where previous liquidity layers are cleared and the market rebuilds organically. Liquidity collapses tend to precede multi-week bottoming phases rather than immediate trend reversals, which means ETH may require time to stabilize once liquidity begins returning.
Altcoin Vector notes that the correction window remains open until liquidity rebuilds. If replenishment begins in the coming weeks, ETH could enter a new expansion phase. However, if liquidity rebuilds slowly, the grind may last longer, leaving ETH structurally vulnerable to further downside or sharp volatility.
Trader Sentiment: A Wait-and-See Approach
Even though accumulation signals are strengthening, many traders who prefer reduced volatility remain hesitant. The ETH Buy Zone provides historical context for long-term accumulation, but it does not eliminate short-term risks. Traders recognize that discounted indicators alone do not confirm that a bottom has already formed.
Because Ether is still within a clear daily downtrend and liquidity clusters remain below, many participants prefer to wait for confirmation. This may include a break of the downtrend, a series of higher lows, or liquidity restoring around key support regions. Until those signals appear, traders who are sensitive to volatility see the market as vulnerable.
What Investors Should Watch Moving Forward
Several key elements will likely determine how ETH behaves within the ETH Buy Zone:
First, the interaction with the liquidity clusters under 3000 will be important. If ETH revisits these ranges and successfully sweeps them without triggering extended sell pressure, it may signal stronger buying interest.
Second, the speed at which liquidity rebuilds will influence the pace of any recovery. Slow rebuilding could extend periods of sideways or downward movement.
Third, the performance of the Mayer Multiple in the coming weeks will show whether ETH remains in a historically favorable zone or re-enters a deeper discount.
Conclusion
The ETH Buy Zone has reappeared as Ether drops to levels last seen in July, supported by the Mayer Multiple falling below 1 and liquidity structures resetting across the market. While these conditions align with past accumulation periods, the presence of dense liquidity clusters and ongoing volatility continues to make the market delicate. For long-term investors, the signals point toward a historically favorable environment, while short-term traders may prefer patience until clearer confirmation emerges. As always, this reflects market analysis and not investment advice.
Keep yourself updated with the latest crypto news with FYI Gazette
Read more about Memecoins with FYI Gazette
Keep yourself updated with the latest Altcoin News with FYI Gazette
 Bitcoin
  Ethereum
  Tether
  BNB
BNB  XRP
XRP  Solana
  TRON
TRON  Dogecoin
  Litecoin
  Pepe
Pepe