
Bitcoin Bollinger Bands Signal Possible Parabolic Surge
Bitcoin Bollinger Bands continue to draw attention as traders study whether the current compression could spark another powerful rally. At the center of the discussion is the behavior of the monthly Bollinger BandWidth, a volatility gauge that has now tightened to historic lows. Analysts suggest that this specific pattern resembles the rare market setup observed in late 2023, a period that preceded a major upward move in Bitcoin. As traders evaluate these signals, many are questioning whether a new parabolic phase may soon emerge if price confirms key technical levels.
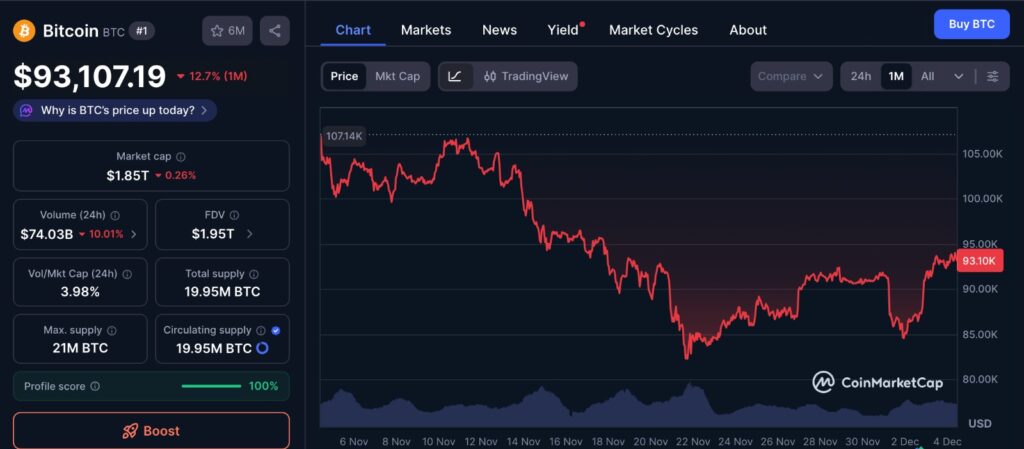
Bitcoin’s recent price action, as shown in the one-month chart above, highlights the ongoing consolidation phase that has shaped market sentiment. Despite several short-term swings, BTC has generally maintained a steady range, reflecting both reduced volatility and cautious trader behavior. This sideways movement aligns with the broader Bollinger Band compression discussed in the article, reinforcing the idea that Bitcoin may be preparing for a decisive move. The chart also shows periodic attempts to break higher, signaling that buyers remain active even as the market awaits stronger confirmation of trend direction.
Understanding the Bitcoin Bollinger Bands Setup
Bitcoin Bollinger Bands are a long-standing volatility tool that compares price movement to standard deviations around a moving average. When the bands narrow, volatility falls, and when they widen, volatility rises. The current tightening on the monthly timeframe is unusual because the spread between the upper and lower bands has never been smaller. For analysts who monitor long-term trends, this contraction can act as a trigger for a strong directional move, often upward in Bitcoin’s historical patterns.
A key part of this analysis involves the Bollinger BandWidth, which translates the shrinking distance between the bands into a measurable signal. When this indicator drops below a specific threshold, past cycles have shown that Bitcoin frequently reacts with high-momentum price action. Historically, similar contractions have created conditions where buyers regain control and push the price sharply higher.
The 2023 Example and Why It Matters Now
One of the strongest references for the current situation is the pattern recorded in November 2023. At that time, Bitcoin experienced a clear Bollinger BandWidth squeeze. Following that compression, Bitcoin nearly doubled in value within four months, surprising even those who expected a bullish breakout. Analysts now point to that rally as proof that volatility compression can act as a precursor to explosive movement.
A well-known market strategist has also compared the present compression to the price behavior of major technology stocks before significant surges. This comparison is not meant to imply identical outcomes but rather to highlight the structural similarities of charts leading into large moves. These parallels contribute to the growing belief that Bitcoin might be on the edge of another powerful phase if conditions align correctly.
Rising Optimism Mixed With Caution Among Traders
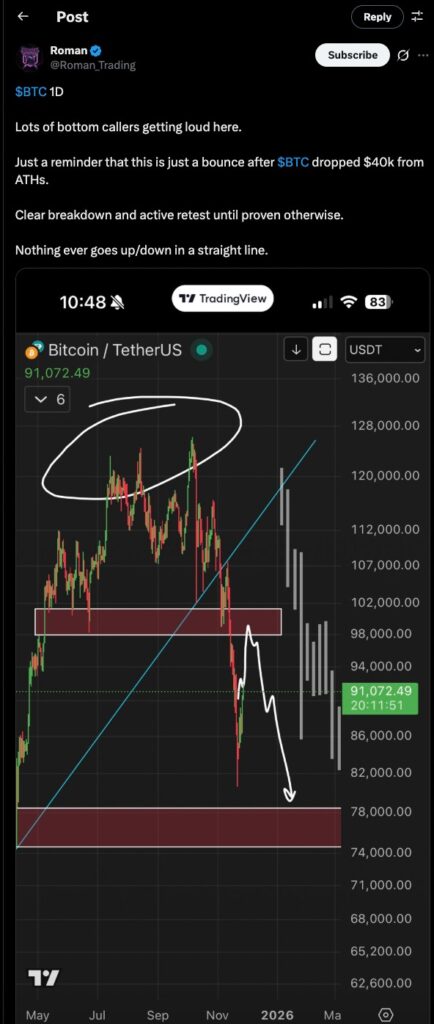
Many traders echo this cautious stance, as highlighted in the screenshot above. Roman emphasizes that the recent bounce may simply be a reaction to Bitcoin’s sharp decline from its highs, rather than a confirmed reversal. His chart outlines a potential breakdown and retest scenario, underscoring that market structure still shows vulnerability. This viewpoint complements the broader discussion around Bitcoin Bollinger Bands, reinforcing the idea that even with historically low volatility signals, price action must prove strength before a sustained uptrend can be assumed.
While the Bitcoin Bollinger Bands point toward potential upside, traders remain divided. Some believe the narrowing bands are a strong bullish signal, while others argue that additional confirmation is needed. Much of the caution stems from momentum indicators that still show weak strength on shorter timeframes. Daily indicators such as MACD and RSI have not fully reset or turned decisively upward, leading some traders to hesitate.
At the same time, Bitcoin recently climbed to its highest levels in more than two weeks, trading near an important resistance zone. That rise followed growing speculation that the broader regulatory environment in the United States may become more supportive of digital assets. Despite this improvement, many analysts insist that Bitcoin must hold above key zones before optimism can be justified.
Why the Year-End Candle Is So Important
Another widely watched metric is the yearly candle close. Analysts note that Bitcoin needs only a small gain from current levels to lock in a yearly close above an important cycle threshold. Achieving that milestone would signal continued strength moving into the next year and could encourage additional upward momentum.
This price zone, which appears to align with long-term cycle models, has become even more meaningful in light of the extreme Bollinger Band compression. A close above that area could validate the bullish interpretation, while failure to hold the level may weaken the current setup.
Bitcoin Bollinger Bands and the Role of Volatility
The significance of the Bitcoin Bollinger Bands lies in their ability to track volatility in a visually clear way. Periods of major expansion often follow long compressions, which is one reason traders are so focused on the current pattern. Yet a contraction in volatility does not guarantee direction. While Bitcoin often breaks upward from such conditions, sideways consolidation can also occur, and bearish reversals cannot be entirely dismissed.
Volume is another factor shaping expectations. For a meaningful rally to form, strong buying volume typically needs to accompany the breakout. So far, volume has been moderate rather than decisive, which adds to the argument that additional confirmation is needed before a rally can be assumed.
What Traders Should Watch Next
The coming weeks may be crucial in determining whether the Bitcoin Bollinger Bands signal plays out as strongly as previous cycles. Traders are watching for:
- Sustained closes above major resistance levels
- An increase in trading volume
- A shift in daily momentum indicators
- Continued support from broader market sentiment
If these elements align, the current compression could mark the beginning of a new upward phase. Conversely, failure to meet these conditions may delay any significant move and extend the consolidation period.
Final Thoughts
The Bitcoin Bollinger Bands indicate one of the tightest volatility squeezes ever seen on the monthly chart. History suggests that such patterns often precede substantial price movements. While analysts see similarities to the late-2023 setup that led to a sharp rally, traders remain cautious as they wait for confirmation. Whether Bitcoin is on the verge of a parabolic surge or entering a longer consolidation phase will likely depend on how price behaves around the key levels currently in focus.
Keep yourself updated with the latest crypto news with FYI Gazette
Read more about Memecoins with FYI Gazette
Keep yourself updated with the latest Altcoin News with FYI Gazette
 Bitcoin
  Ethereum
  Tether
  BNB
BNB  XRP
XRP  Solana
  TRON
TRON  Dogecoin
  Litecoin
  Pepe
Pepe