
RAVE price rally signals recovery after launch dip
RAVE price rally has drawn strong attention after the token rebounded sharply from its post-launch decline. Following an initial sell-off that pushed prices lower, RAVE staged a notable recovery, raising the question of whether the correction phase is already complete. By examining price action, volume trends, and liquidity behavior, a clearer picture emerges of what is driving this move and what risks still remain.
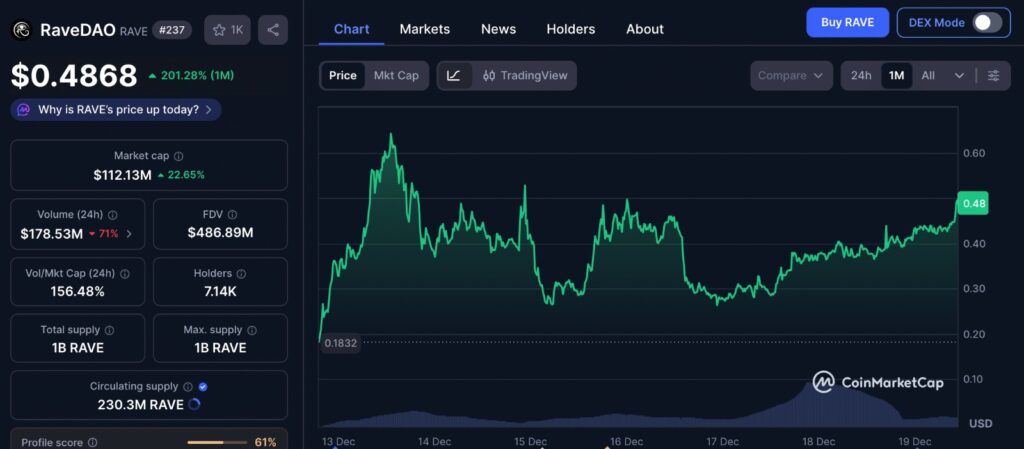
The one-month price chart highlights the volatility that has defined RAVE’s early trading phase. After launching at higher levels, the token experienced a sharp pullback before finding a temporary base, followed by a strong rebound that aligns with the recent RAVE price rally. The chart reflects periods of heightened trading activity during both the decline and recovery, suggesting active participation rather than thin liquidity. This pattern supports the view that selling pressure has eased compared to the initial launch phase, while also showing that price action remains sensitive to shifts in momentum.
RAVE price rally begins after early sell-off
The RAVE price rally comes shortly after the token’s launch, which initially saw heavy selling pressure. RAVE began trading near the $0.50 level but quickly dropped to around $0.27 as early participants took profits. This type of price behavior is common for newly launched tokens, where early enthusiasm fades and the market seeks a more stable valuation.
After reaching its local low, RAVE reversed direction and climbed back toward its launch price. Within a single day, the token surged by approximately 29 percent, signaling a strong short-term recovery. At the same time, trading volume increased by more than 20 percent, suggesting that buyers were returning to the market with renewed confidence.
This rebound has shifted sentiment from bearish to cautiously optimistic, as traders reassess whether the worst of the selling pressure has already passed.
Technical signals behind the RAVE price rally
From a technical perspective, the RAVE price rally showed mixed but improving signals. The token moved above the SuperTrend indicator, which often points to a short-term bullish bias. However, price action also breached a rising trendline, highlighting that the recovery was not yet fully confirmed.
On lower timeframes, RAVE traded within a narrow range, finding support near the $0.35 level while facing resistance around $0.42. This sideways movement reflected hesitation among traders, with buyers and sellers closely matched. Such consolidation often occurs after sharp rebounds, as the market pauses before choosing a clear direction.
Another important metric was Open Interest, which climbed above $17 million. Rising Open Interest generally indicates increasing participation from traders using leverage, suggesting that confidence in further price movement was building.
Is the post-launch correction over?
The key question surrounding the RAVE price rally is whether the post-launch correction has ended. The quick recovery from the lows and the return to the launch price are encouraging signs. They suggest that early sellers may have exited and that new participants are stepping in.
However, the presence of resistance and ongoing consolidation indicates that the market has not fully committed to a sustained uptrend. While downside pressure has weakened, it has not completely disappeared. This places RAVE in a transition phase, where confirmation of a trend requires stronger follow-through.
Exchange listings and capital rotation support RAVE price rally
One of the main drivers behind the RAVE price rally was increased exposure through additional exchange listings. The token became available on both spot and derivatives markets across major platforms, improving accessibility and liquidity. Broader exchange support often attracts new traders who prefer established trading venues.
At the same time, capital rotation within the broader crypto market played a role. As Bitcoin declined below key psychological levels, traders shifted funds toward smaller-cap tokens in search of higher percentage returns. RAVE benefited from this rotation, as speculative interest increased during a period of weakness in larger assets.
On-chain data showed that a well-positioned trader was able to capture profits during the initial rally, but despite this profit-taking, the number of token holders continued to grow. The holder count climbed to over seven thousand, while market capitalization approached $85 million. This growth in holders suggests expanding interest beyond early participants.
Liquidity and leverage risks around RAVE price rally
Liquidity dynamics are critical to understanding how the RAVE price rally may evolve. Price heatmaps revealed a significant concentration of orders above the current price. These clusters can act as resistance if buying pressure is insufficient to absorb sell orders.
Leverage data showed that long positions outweighed short positions by a notable margin. Long leverage stood near $5.66 million, compared to approximately $3.15 million in short exposure. This imbalance reflects bullish sentiment but also introduces risk. If price fails to move higher, heavily leveraged long positions could be forced to close, increasing volatility.
On the other hand, if price rises into zones where short positions are concentrated, forced liquidations could accelerate upward movement. This makes upcoming price levels especially important for determining short-term direction.
What traders should watch next
For traders evaluating the RAVE price rally, attention should remain on key support and resistance levels. Sustained trading above resistance would strengthen the case for a trend continuation, while repeated rejection could signal renewed weakness.
Volume behavior will also be crucial. Continued high volume during upward moves would suggest genuine demand, while declining volume could indicate fading momentum. Additionally, changes in Open Interest can reveal whether traders are building new positions or exiting existing ones.
In summary, the RAVE price rally shows promising signs after an aggressive post-launch correction. The rebound, rising volume, expanding holder base, and increased exchange exposure all point to improving sentiment. However, technical resistance and leverage-related risks mean that volatility remains likely.
While the correction may be losing strength, confirmation of a lasting trend will depend on how RAVE behaves around key liquidity levels in the days ahead.
Keep yourself updated with the latest crypto news with FYI Gazette
Read more about Memecoins with FYI Gazette
Keep yourself updated with the latest Altcoin News with FYI Gazette
 Bitcoin
  Ethereum
  Tether
  BNB
BNB  XRP
XRP  Solana
  TRON
TRON  Dogecoin
  Litecoin
  Pepe
Pepe