
Bitcoin Trendline Rejection Pushes BTC Toward 85K
Bitcoin Trendline Rejection is shaping Bitcoin’s current market behavior as the price struggles to maintain upward momentum. Bitcoin recently failed to break above a long-standing descending trendline, triggering renewed selling pressure and pushing the asset closer to the $85,000 level. This rejection reflects ongoing technical weakness, even as on-chain data suggests strong confidence among longer-term holders.
The market is currently caught between bearish technical signals and constructive supply dynamics. While price action appears vulnerable in the short term, underlying exchange data tells a more complex story that investors are closely watching.
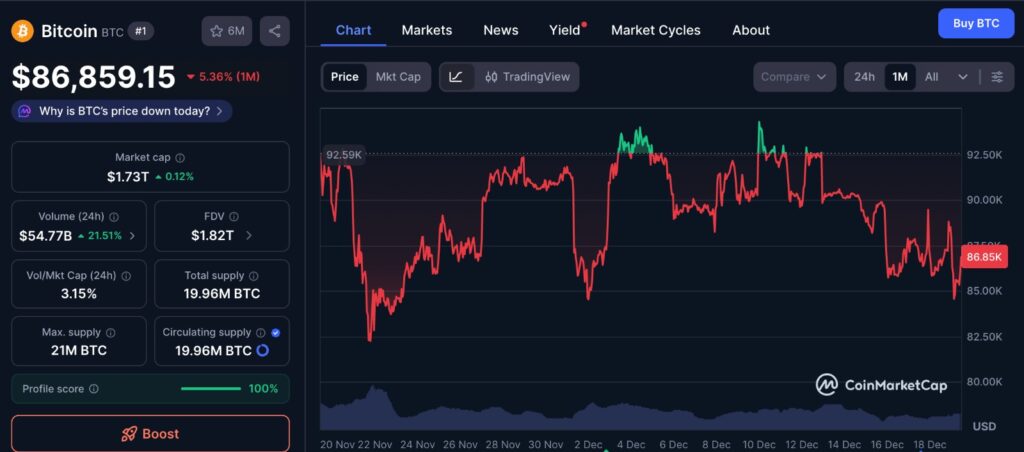
The CoinMarketCap chart above highlights Bitcoin’s price movement over the past month, showing increased volatility and repeated rejection near key resistance levels. The price action reflects the recent Bitcoin trendline rejection, where upward attempts were met with selling pressure before BTC drifted back toward the mid-$80,000 range. This one-month view helps illustrate how momentum has weakened in the short term, while price continues to move within a defined range rather than establishing a clear breakout or breakdown.
Bitcoin Trendline Rejection and Key Technical Levels
Rejection at a Major Resistance Zone
Bitcoin attempted to move higher but was firmly rejected near a descending trendline that has acted as resistance for several weeks. This trendline has capped multiple rallies, making it a critical technical barrier. Once Bitcoin failed to break through, sellers quickly regained control, forcing the price back into a lower trading range.
The Bitcoin trendline rejection confirmed that bullish momentum remains weak. Without a strong breakout above resistance, buyers appear hesitant to commit, allowing sellers to dominate short-term price movements. As a result, Bitcoin slid toward the $85,000 region, which now acts as a key psychological and technical level.
Bearish Indicators Strengthen Short-Term Control
Following the rejection, technical indicators across multiple time frames pointed to growing downside risk. Chart patterns suggest that sellers continue to defend resistance aggressively, preventing sustained upside moves. Each failed attempt to push higher reinforces bearish confidence and increases the likelihood of further consolidation or decline.
Until Bitcoin can reclaim the trendline and establish higher support, short-term sentiment is likely to remain cautious. Traders focused on momentum and technical setups are responding to these signals by reducing exposure or positioning defensively.
Exchange Outflows Offer a Contrasting Signal
Bitcoin Trendline Rejection vs Exchange Behavior
Despite bearish price action, Bitcoin trendline rejection is not the only story unfolding. On-chain data reveals persistent net outflows from major exchanges, particularly Binance. This means more Bitcoin is being withdrawn than deposited, even as prices weaken.
Such behavior often suggests that investors are moving assets into private wallets rather than preparing to sell. In many past market cycles, sustained exchange outflows have aligned with accumulation phases rather than panic selling.
Long-Term Holders Show Confidence
Large withdrawal spikes have been observed during periods of price weakness. These withdrawals often occur when Bitcoin dips below important levels, implying that some participants view pullbacks as buying opportunities. This behavior points to confidence among longer-term holders who are less concerned with short-term price swings.
While exchange outflows do not guarantee immediate price recovery, they do reduce the amount of Bitcoin available for quick selling. Over time, this tightening supply can help stabilize prices once demand improves.
Understanding the Market’s Mixed Signals
Bitcoin Trendline Rejection Creates Divergence
The market is currently displaying a clear divergence. Bitcoin trendline rejection suggests weakness from a technical perspective, while exchange outflows signal strength in underlying holder behavior. This split often appears during transitional phases when markets are consolidating rather than trending strongly in one direction.
Short-term traders tend to focus on price patterns, resistance levels, and momentum indicators. Long-term investors, however, often pay closer attention to supply dynamics and accumulation trends. The result is a market where selling pressure and accumulation coexist.
The Role of Leverage and Volatility
Leverage plays a significant role in amplifying these mixed signals. Trendline rejections frequently trigger stop losses and liquidations, accelerating downward moves. At the same time, longer-term buyers may quietly accumulate during these periods, creating a disconnect between price and underlying demand.
This environment can feel confusing, as price weakness does not always reflect deteriorating fundamentals. Instead, it often reflects temporary imbalances driven by technical trading behavior.
What Happens If Support Breaks or Holds
Key Levels to Monitor Closely
Bitcoin’s immediate support zone lies between $84,000 and $86,000. Holding above this range could help slow selling pressure and allow the market to stabilize. A clean bounce from this area may set the stage for another attempt at breaking the descending trendline.
If this support fails, however, downside risk increases. A breakdown below this range could invite further selling as traders react to lost support, potentially driving Bitcoin toward lower liquidity zones.
Exchange Supply Remains Critical
Regardless of short-term price movements, exchange supply trends remain an important metric. Continued outflows suggest that selling pressure may be limited over time. If withdrawals persist while price consolidates, the market could gradually shift toward a more balanced state.
Investors monitoring Bitcoin trendline rejection should therefore track both chart behavior and exchange data to gain a clearer understanding of market direction.
Final Outlook for Bitcoin Trendline Rejection
Bitcoin trendline rejection is currently keeping BTC under pressure, preventing sustained upside momentum and exposing the price to short-term weakness. Sellers remain active near resistance, and technical indicators continue to favor caution.
At the same time, steady exchange outflows reveal confidence among longer-term holders who appear willing to accumulate during pullbacks. This contrast suggests that while Bitcoin may struggle in the short term, the broader market structure remains supported by strong holder behavior.
As long as Bitcoin trades below the descending trendline, volatility is likely to persist. However, if supply continues to tighten and support holds, the groundwork may be forming for a more stable phase ahead.
Keep yourself updated with the latest crypto news with FYI Gazette
Read more about Memecoins with FYI Gazette
Keep yourself updated with the latest Altcoin News with FYI Gazette
 Bitcoin
  Ethereum
  Tether
  BNB
BNB  XRP
XRP  Solana
  TRON
TRON  Dogecoin
  Litecoin
  Pepe
Pepe