
Bitcoin Sell Wall at 95K Blocks BTC Price Recovery
Bitcoin sell wall pressure near the 95,000 level has become a major obstacle for Bitcoin as it attempts to regain upward momentum. Despite short-term rebounds, sellers continue to absorb buying pressure, preventing a clean breakout and leaving traders cautious about near-term price direction.
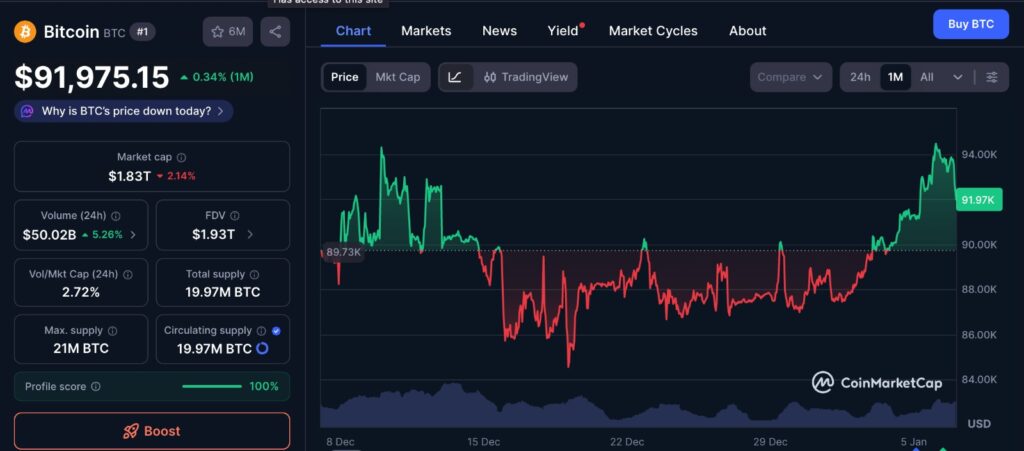
The chart above shows Bitcoin’s price performance over the past month, highlighting the repeated attempts to move higher before encountering resistance. Price action reflects consolidation within a defined range, with upward momentum slowing as Bitcoin approaches the 95,000 area. This behavior aligns with broader market observations of strong selling pressure at key levels, while support continues to hold below. The chart reinforces the current range-bound structure, where buyers and sellers remain in balance as the market awaits a decisive breakout or rejection.
Bitcoin sell wall stalls BTC recovery
The Bitcoin sell wall around 95,000 has repeatedly capped price advances, acting as a strong resistance zone. As Bitcoin climbed toward this level, order book data showed large sell orders stacked above price, effectively halting momentum. This resistance appeared during a period when broader markets were stable and traditional safe-haven assets like gold were outperforming.
Bitcoin briefly pushed toward its highest levels in weeks but failed to hold above resistance. As the price approached 95,000, buying pressure weakened, longs exited positions, and sellers regained control. This behavior reinforced the idea that the sell wall is not just technical noise, but a meaningful barrier driven by large market participants.
How the Bitcoin sell wall affects market behavior
Heavy resistance near 95K
The Bitcoin sell wall represents a cluster of sell orders that absorb demand as price rises. When Bitcoin nears this zone, upward moves slow dramatically. Traders often describe this as a “big money” resistance area, where large holders are either taking profits or actively defending price levels.
As Bitcoin tested this area, market momentum faded quickly. Traders observed that liquidity dried up above 94,000, while sell orders continued to refill, keeping price suppressed. This behavior suggests that sellers remain confident at these levels, at least in the short term.
Impact on trader sentiment
Repeated rejection from the Bitcoin sell wall has affected sentiment. Instead of aggressive buying, traders have shifted to shorter-term strategies, waiting for confirmation before committing capital. Many are unwilling to chase price higher unless Bitcoin can clearly break above resistance with strong volume.
At the same time, sellers appear comfortable maintaining pressure, knowing that buyers have failed to push through multiple times. This standoff has resulted in choppy price action and limited follow-through in either direction.
Bitcoin sell wall versus gold performance
Bitcoin struggles as gold rises
While Bitcoin faced resistance, gold continued to trend higher. This contrast drew attention from traders comparing Bitcoin’s role as a store of value against traditional assets. Gold’s strength highlighted Bitcoin’s short-term weakness, especially as macro uncertainty increased interest in safer assets.
The comparison does not necessarily imply long-term weakness for Bitcoin, but it does emphasize that, in the current environment, capital has favored gold over BTC. Until Bitcoin clears the sell wall, this divergence may persist.
Market rotation and risk appetite
Some analysts believe the Bitcoin sell wall reflects broader risk behavior. As investors rotate into assets perceived as lower risk, Bitcoin faces additional headwinds near key resistance levels. This does not invalidate Bitcoin’s longer-term outlook, but it does complicate near-term price recovery.
Key support levels holding firm
Weekly support near 93,500
Despite resistance above, Bitcoin has held important support around 93,500. This level aligns with a major weekly reference point and has acted as a floor during recent pullbacks. Holding above this zone is critical for maintaining a constructive market structure.
A weekly close above this support level suggests that buyers are still defending the broader range. If Bitcoin were to lose this level, downside risk would increase significantly, potentially inviting deeper corrections.
Range structure remains intact
For now, Bitcoin remains trapped between strong support near 93,500 and resistance created by the Bitcoin sell wall near 95,000. This tight range reflects uncertainty rather than weakness, with both buyers and sellers waiting for a decisive move.
What traders are watching next
Breakout or rejection
The primary question for traders is whether Bitcoin can absorb the sell wall and push higher, or whether sellers will continue to dominate. A clean breakout above 95,000 with strong volume would likely trigger renewed bullish momentum and force sellers to retreat.
On the other hand, continued rejection could lead to extended consolidation or another test of lower support levels. Traders are closely monitoring volume, order flow, and momentum indicators for early signals.
External catalysts
Macro events, shifts in equity markets, and changes in monetary expectations could influence Bitcoin’s ability to break resistance. Any increase in risk appetite may support a breakout attempt, while renewed uncertainty could strengthen the sell wall further.
Crypto-specific developments, including institutional flows and market liquidity conditions, will also play a role in determining whether buyers gain enough strength to overcome resistance.
Understanding the Bitcoin sell wall
Order book dynamics
The Bitcoin sell wall highlights how order book liquidity can control price movement. Large sell orders act as barriers, forcing buyers to commit significant capital to push price higher. Without sustained demand, price tends to stall or reverse near these zones.
Sell walls are not permanent, but they require strong conviction from buyers to overcome. Until that happens, price often remains range-bound.
Risk management implications
For traders, the presence of a Bitcoin sell wall provides clear reference points for risk management. Resistance near 95,000 and support near 93,500 define the current trading range, helping traders plan entries, exits, and stop levels with greater precision.
Editor’s View: Why resistance feels heavier than charts suggest
What the chart does not show is hesitation. When price repeatedly approaches the same level and fails, traders begin to remember those failures, and behavior changes even before resistance is reached. Buyers become quicker to take profits, while sellers gain confidence that they do not need to chase the market lower. Over time, this collective memory can make a resistance zone feel heavier than its raw order book data suggests, reinforcing consolidation without any dramatic move.
Conclusion
The Bitcoin sell wall at 95,000 remains a defining feature of current market structure. While Bitcoin has shown resilience by holding key support levels, repeated rejection at resistance has limited upside progress. As gold outperforms and broader markets stabilize, Bitcoin traders remain cautious.
Whether Bitcoin breaks through this sell wall or continues to consolidate will depend on volume, sentiment, and external catalysts. Until then, the market remains balanced between strong resistance and equally important support, setting the stage for a decisive move ahead.
Disclaimer: This content is for informational purposes only and does not constitute financial advice.
Keep yourself updated with the latest crypto news with FYI Gazette
Read more about Memecoins with FYI Gazette
Keep yourself updated with the latest Altcoin News with FYI Gazette
 Bitcoin
  Ethereum
  Tether
  BNB
BNB  XRP
XRP  Solana
  TRON
TRON  Dogecoin
  Litecoin
  Pepe
Pepe