
IOTA Weekly Rally Signals Strength but Risks Remain
IOTA Weekly Rally momentum has become a major talking point in the crypto market after the token recorded a sharp 35 percent rise within a single week. This sudden price expansion marked a clear shift in sentiment after a long period of consolidation and weak performance. As traders reacted to technical breakouts and improving indicators, IOTA gained renewed attention across both spot and derivatives markets.
The rally did not appear out of nowhere. It followed a sustained buildup of bullish sentiment and technical signals that hinted at a possible breakout. As price action improved, confidence among market participants strengthened, creating a feedback loop that pushed IOTA higher. While the surge is impressive, understanding what fueled it and what risks still exist is essential for evaluating whether the move can continue.
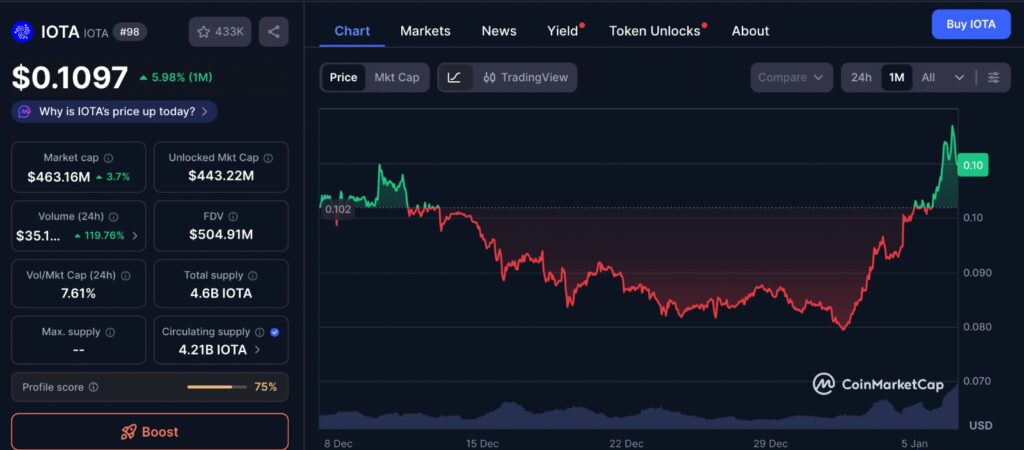
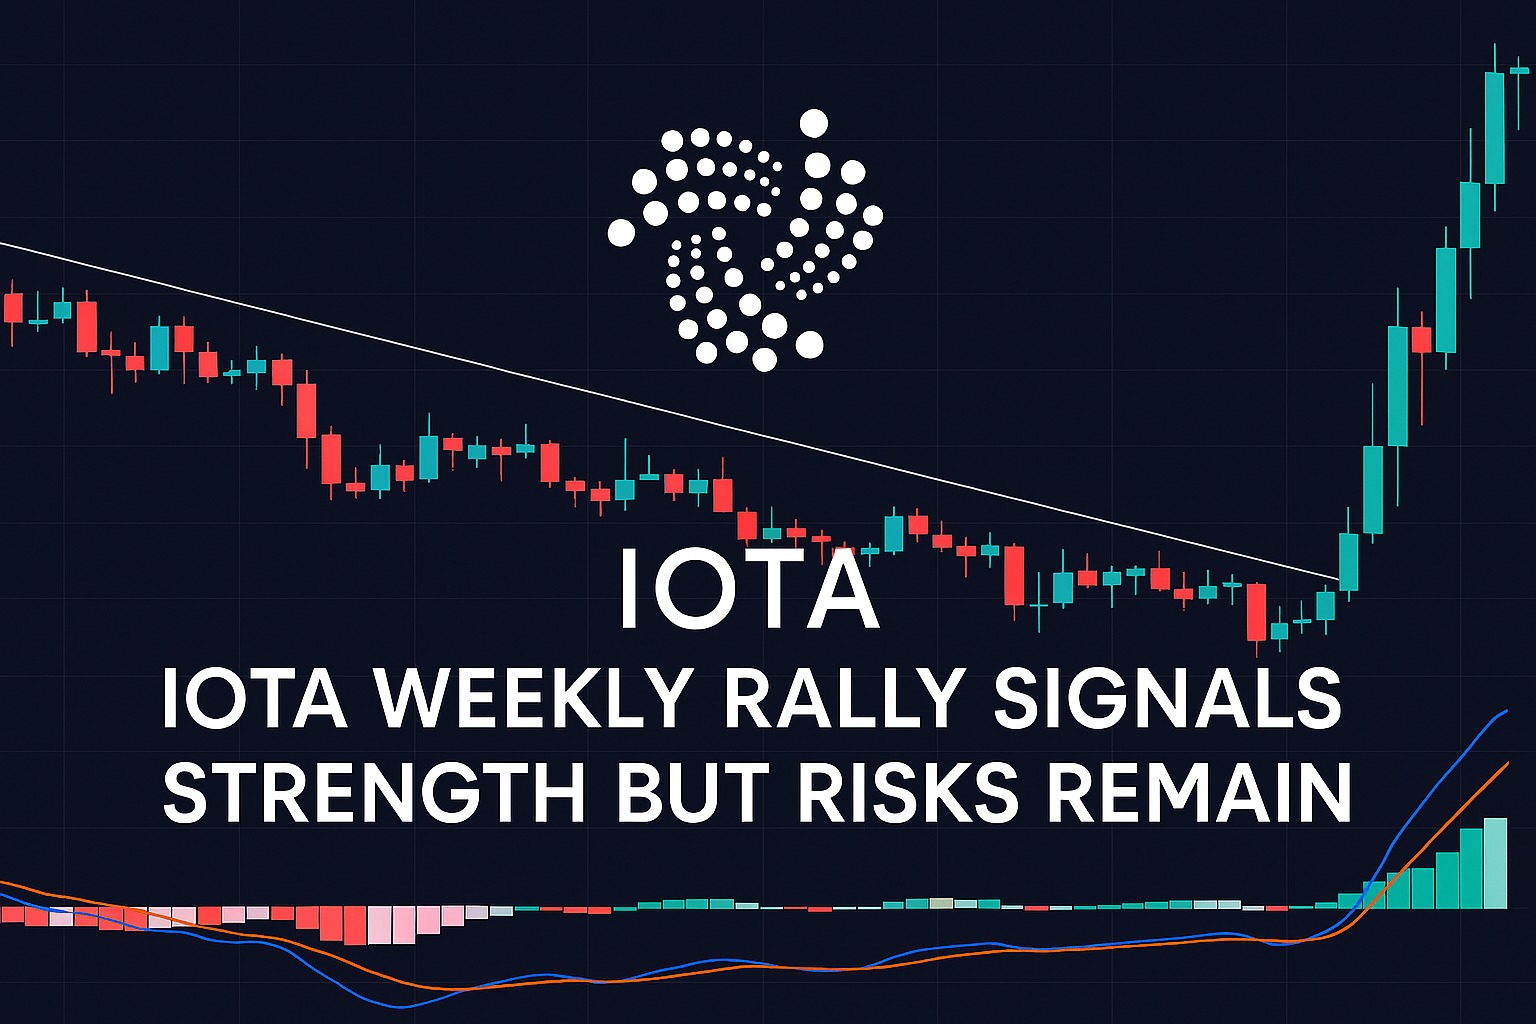
Viewed over the past month, the IOTA price chart highlights how quickly sentiment can shift once a long-held range is broken. What stands out is not just the speed of the move, but the lack of extended consolidation during the advance, suggesting that sellers stepped aside rather than actively defending prior levels. At the same time, the chart shows that momentum built progressively rather than spiking in a single burst, which often reflects growing participation rather than isolated trading events. This context helps explain why the recent move feels structurally different from earlier short-lived rebounds.
IOTA Weekly Rally Driven by Market Sentiment
One of the strongest contributors to the IOTA Weekly Rally was a clear shift in market sentiment. Bullish expectations rose sharply, with sentiment trackers showing a strong majority of participants leaning positive. This shift in outlook helped bring sidelined buyers back into the market and encouraged existing holders to stay invested rather than take profits early.
This positive sentiment aligned closely with IOTA breaking above a long-standing descending trendline. For months, this resistance had limited price growth. Once it was broken, technical traders viewed it as a confirmation of a trend reversal. Breakouts of this nature often attract momentum traders, adding further buying pressure and accelerating price movement.
Confidence Builds After Resistance Break
Breaking above key resistance zones often changes how traders view risk. In IOTA’s case, the breakout signaled that sellers were losing control and buyers were gaining strength. As a result, confidence grew rapidly, pushing the token toward higher price levels that had not been tested in a long time.
This type of move can also influence investor psychology. When resistance turns into support, traders are more willing to enter positions on pullbacks, helping stabilize price action after sharp rallies.
Technical Indicators Supporting the IOTA Weekly Rally
Technical indicators played a major role in validating the IOTA Weekly Rally. One of the most notable signals came from the Moving Average Convergence Divergence indicator. After spending an extended period in negative territory, the MACD flipped bullish as its main line crossed above the signal line. This change often suggests growing momentum and increased buying strength.
In addition, accumulation metrics showed that buyers were steadily entering the market rather than engaging in short-term speculation. Rising accumulation alongside price growth suggests that investors are building positions with longer-term confidence, which can help support sustained upward movement.
Volume and Momentum Alignment
Healthy rallies are usually supported by volume, and IOTA’s move followed this pattern. Trading activity increased alongside price, reinforcing the idea that the rally was backed by real demand. When volume rises with price, it reduces the likelihood that the move is purely speculative or driven by low liquidity.
Momentum indicators also remained elevated throughout the rally. While this confirms strength, it can also signal that the asset may become overheated if buying pressure slows.
Derivatives Market Adds Fuel to IOTA Weekly Rally
The derivatives market showed strong interest during the rally. Open Interest increased as traders opened more positions, indicating growing confidence in continued upside. Funding rates also turned positive, meaning traders were willing to pay a premium to maintain long positions.
This behavior suggests that many traders expect higher prices in the short term. However, heavy reliance on derivatives can increase volatility. If sentiment shifts suddenly, leveraged positions may unwind quickly, leading to sharp pullbacks.
Spot Market Shows Mixed Behavior
While derivatives traders were clearly optimistic, the spot market painted a more cautious picture. Some selling pressure appeared as holders took advantage of higher prices to lock in profits. Although the selling volume was not large enough to stop the rally, it highlighted that not all participants share the same level of confidence.
This divergence between spot and derivatives markets is important. Sustainable rallies typically require strong support from spot buyers. If spot demand weakens while leveraged positions remain high, price stability can be threatened.
Editor’s View: Interpreting the IOTA Weekly Rally Beyond Charts
Price action alone does not fully explain the IOTA Weekly Rally, especially after a prolonged period of underperformance. When an asset lags for months, even a moderate breakout can trigger outsized reactions as traders reassess long-held assumptions. Part of the recent momentum likely reflects repositioning rather than fresh conviction, with participants adjusting exposure after realizing the market narrative has shifted. This kind of rally often carries mixed intent, combining genuine optimism with delayed responses from traders who had previously written the asset off.
Risks That Could Challenge the IOTA Weekly Rally
Despite strong momentum, the IOTA Weekly Rally is not without risks. One key concern is the lack of consistent follow-through buying. After sharp breakouts, markets often pause or retrace if new buyers fail to enter at higher levels.
Another risk lies in approaching resistance zones. As price moves closer to historically important levels, sellers may become more active. If buying pressure is not strong enough to overcome this supply, IOTA could face consolidation or correction.
Overbought conditions are also worth monitoring. Rapid price increases can push indicators into extreme zones, making short-term pullbacks more likely even within an overall bullish trend.
Outlook for IOTA Weekly Rally Going Forward
The IOTA Weekly Rally reflects a strong combination of improving sentiment, technical confirmation, and trader participation. Breaking out of long-term resistance has changed the market structure and opened the door for further gains if momentum holds.
However, the rally’s sustainability depends on continued demand, especially from spot market participants. Without steady accumulation, the price may struggle to maintain its current trajectory. Traders should also watch for changes in funding rates and Open Interest, as sudden shifts could signal weakening confidence.
In conclusion, the IOTA Weekly Rally represents a meaningful shift in market dynamics, but it is still at a critical stage. While the bullish case remains intact for now, careful observation of volume, sentiment, and resistance levels will be essential in determining whether this rally evolves into a longer-term uptrend or fades into consolidation.
Disclaimer: This content is for informational purposes only and does not constitute financial advice.
Keep yourself updated with the latest crypto news with FYI Gazette
Read more about Memecoins with FYI Gazette
Keep yourself updated with the latest Altcoin News with FYI Gazette
 Bitcoin
  Ethereum
  Tether
  BNB
BNB  XRP
XRP  Solana
  TRON
TRON  Dogecoin
  Litecoin
  Pepe
Pepe