
Sui pullback risk after SUI breakout
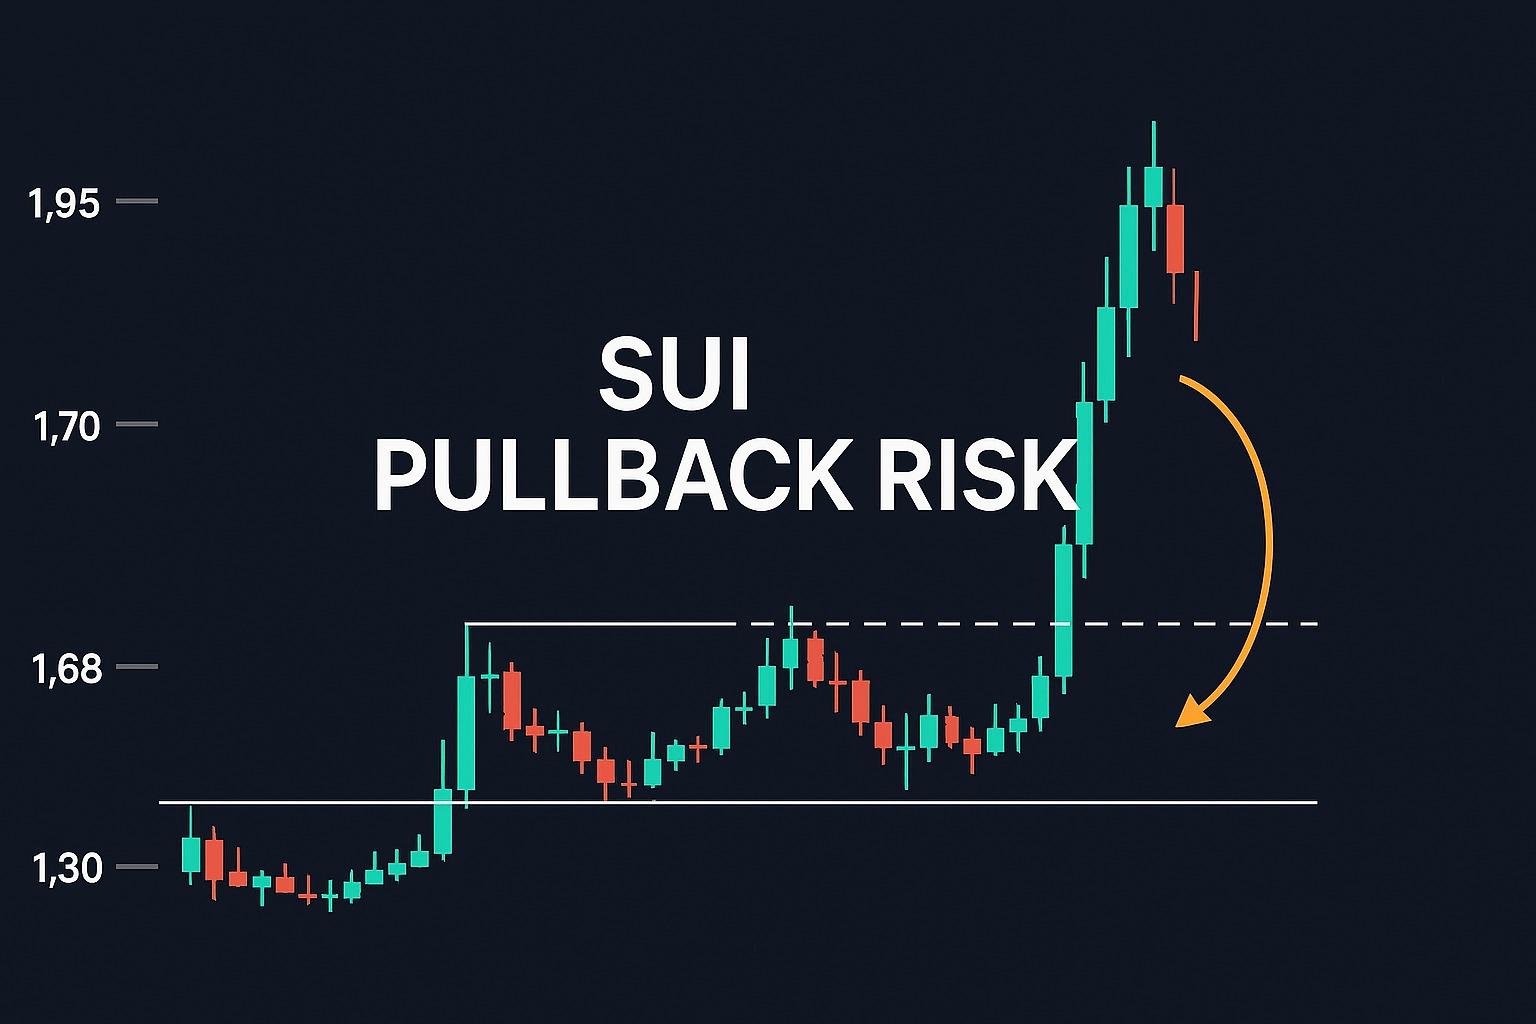
Sui pullback risk has become a key discussion point among traders after SUI delivered a sharp breakout from its recent trading range. The token rallied aggressively at the start of the year, pushing prices toward major resistance levels. While the move reflects strong bullish momentum, technical signals suggest that a temporary retracement toward $1.70 could occur before any further upside continuation.
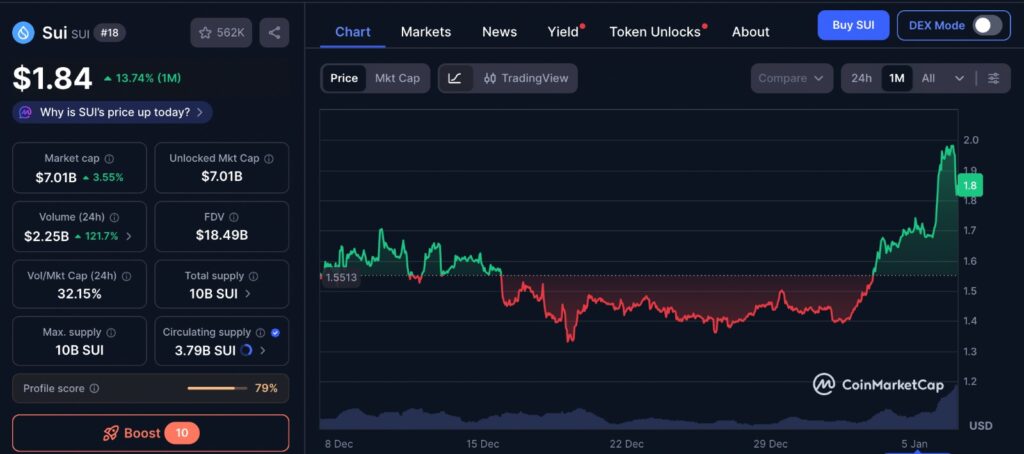
Viewed over the past month, SUI’s price action highlights how quickly sentiment can shift once a range is broken. The chart shows a period of compression followed by a sharp expansion, a pattern that often draws in late participants after momentum becomes obvious. What stands out is not just the size of the move, but its speed, which can compress decision-making time for traders. In these situations, short-term volatility often reflects positioning adjustments rather than a clear change in underlying conviction.
Sui pullback risk following the recent breakout
SUI began the year with a notable price surge after falling to around $1.39. From that low, the token rallied nearly 40 percent, reaching highs close to $1.95 in just a few days. This move marked a clear breakout from the consolidation zone between $1.30 and $1.68, a range that had capped price action for an extended period.
Breaking out of a range is often seen as a bullish signal, as it indicates buyers are willing to step in aggressively. However, such strong moves can also exhaust short-term momentum, especially when price approaches areas where selling pressure previously existed. In SUI’s case, price is now approaching a broader resistance region between $1.95 and $2.16, increasing the probability of a pause or pullback.
Technical structure highlights Sui pullback risk
From a technical perspective, the lower time frame structure for SUI has flipped bullish. The price managed to break above a previous swing high near $1.51, confirming short-term bullish control. This shift explains the strong upside momentum seen during the recent rally.
Despite this, the higher time frame trend has not fully turned bullish. For a complete trend reversal, SUI needs to break above major supply zones above $2.20. Until that happens, the market remains vulnerable to pullbacks, especially after such a rapid move upward. This mixed structure is one of the main reasons Sui pullback risk remains elevated.
Additionally, Fibonacci retracement levels drawn from December highs and lows place significant resistance in the $1.87 to $2.03 range. When price reaches zones where multiple resistance factors align, it often triggers profit-taking. This does not necessarily signal weakness, but rather a normal market reaction after strong gains.
Why $1.70 is critical to Sui pullback risk
The $1.70 level plays a crucial role in evaluating Sui pullback risk. After the breakout, this zone sits just above the former resistance range and could now act as support. If price pulls back, this area is where buyers are most likely to step in and defend the trend.
Former resistance levels often become support after a breakout, but this transition must be tested. A pullback toward $1.70 would allow the market to confirm whether demand remains strong. If buyers successfully hold this level, it would strengthen the case for continued upside over time.
On the other hand, failure to hold $1.70 could expose SUI to deeper retracements back into the previous range. This is why traders are closely monitoring price behavior around this zone before committing to new long positions.
Market participation supports bullish momentum
Despite concerns around Sui pullback risk, participation metrics show encouraging signs. Open Interest rose significantly during the breakout, indicating increased involvement from traders. Rising Open Interest during an uptrend often reflects confidence and strong speculative interest.
Volume data also supported the rally, suggesting that buyers were actively driving price higher rather than relying on low-liquidity moves. This kind of participation generally improves the sustainability of a trend, even if short-term corrections occur.
However, when Open Interest increases rapidly near resistance zones, it can also amplify volatility. If price fails to break higher, leveraged positions may unwind, accelerating a pullback toward support levels like $1.70.
Broader market factors influencing Sui pullback risk
Sui pullback risk is also influenced by overall crypto market conditions. When major assets face resistance or consolidate, altcoins often experience increased volatility. If broader sentiment weakens, even strong-performing tokens like SUI can see temporary retracements.
Another factor traders are watching is token supply dynamics. Events that increase circulating supply can introduce short-term selling pressure, particularly after rallies. While these events do not necessarily change long-term outlooks, they can impact short-term price action.
These broader factors make it important to view SUI’s breakout within the larger market context rather than in isolation.
Key levels traders are watching next
To manage Sui pullback risk effectively, traders are focusing on several critical levels:
Resistance confirmation
A clean breakout and sustained hold above the $2.20 region would significantly reduce pullback risk and signal stronger bullish continuation.
Support validation
A controlled retracement toward $1.70 followed by strong buying interest would confirm this zone as reliable support.
Market sentiment alignment
Continued strength in the broader crypto market would improve the chances of SUI maintaining its upward trajectory.
Editor’s View: Understanding trader hesitation after fast rallies
One aspect charts rarely capture is trader hesitation after rapid price expansion. When an asset like SUI moves sharply in a short time, many participants are less focused on where price could go next and more concerned with protecting unrealized gains. This often creates a pause in momentum, not because conviction disappears, but because decision-making becomes more cautious. In these moments, pullbacks tend to reflect uncertainty and risk management rather than a shift in broader sentiment.
Conclusion
SUI’s recent breakout has positioned it as one of the strongest performers in the market, but Sui pullback risk remains a valid short-term concern. The rapid rally toward major resistance zones increases the likelihood of a retracement toward $1.70 as traders take profits and test demand.
Such a pullback would not necessarily be bearish. Instead, it could provide a healthier structure for sustained growth if support holds. By watching key technical levels and overall market conditions, traders can better navigate both the opportunities and risks surrounding SUI’s next move.
Disclaimer: This content is for informational purposes only and does not constitute financial advice.
Keep yourself updated with the latest crypto news with FYI Gazette
Read more about Memecoins with FYI Gazette
Keep yourself updated with the latest Altcoin News with FYI Gazette
 Bitcoin
  Ethereum
  Tether
  BNB
BNB  XRP
XRP  Solana
  TRON
TRON  Dogecoin
  Litecoin
  Pepe
Pepe