
AVAX Liquidity Rally Odds Explained
AVAX Liquidity Rally is becoming a major talking point among traders as Avalanche shows signs of potential volatility despite ongoing bearish pressure. While price action has remained weak for months, liquidity data and on-chain metrics suggest that movement could be building beneath the surface. For traders, understanding how liquidity influences price is essential before positioning for the next move.
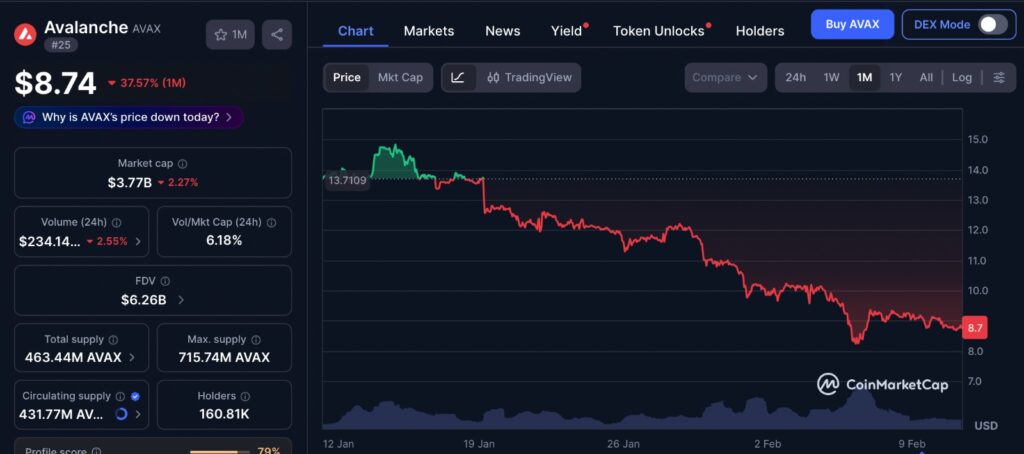
Over the past month, AVAX’s price action has reflected steady pressure with brief attempts at stabilization rather than a decisive reversal. The chart shows lower highs and controlled pullbacks, suggesting that sellers have remained active while volatility gradually compressed. Instead of sharp spikes, the movement appears measured, which often indicates positioning adjustments rather than panic-driven exits. This kind of structure typically precedes either a liquidity sweep or a volatility expansion, depending on how price reacts near key levels.
Why AVAX Liquidity Rally Is Gaining Attention
The idea behind a possible AVAX Liquidity Rally is not based purely on optimism. Instead, it comes from how liquidity clusters are forming around key price levels. Liquidity refers to areas where a large number of buy or sell orders are concentrated. These zones often act as magnets for price because markets naturally move toward areas with unfilled orders.
At the same time, Avalanche has recorded notable network activity. Monthly net inflows into the ecosystem have remained strong, even during market downturns. This shows that capital continues to circulate within the network despite broader uncertainty.
Such divergence between price weakness and network strength can sometimes precede volatility. When fundamentals remain stable but price compresses, liquidity becomes increasingly important.
On-Chain Activity Supporting AVAX Liquidity Rally
One of the most important signals supporting the AVAX Liquidity Rally narrative is the rise in active addresses. The network has experienced a significant increase in user activity, indicating real engagement rather than purely speculative trading.
High transaction counts suggest that users continue interacting with decentralized applications and protocols on Avalanche. Sustained network usage strengthens the ecosystem’s foundation and can provide structural support during price drawdowns.
While strong on-chain metrics do not guarantee a rally, they reduce the likelihood of complete structural weakness. This makes liquidity levels even more relevant because price may react sharply if key zones are approached.
AVAX Price Structure and Current Market Position
Despite encouraging network metrics, AVAX has experienced a deep correction from its previous highs. The token has retraced more than 80 percent from its peak and has been trading near lower support levels.
Such a large drawdown often leads to exhaustion among sellers. When price consolidates after extended decline, it creates conditions where even moderate buying pressure can trigger noticeable moves.
Momentum indicators have also shown oversold conditions. Oversold readings can sometimes indicate that downward momentum is slowing. However, oversold signals alone do not confirm a reversal. They only suggest that selling pressure may be stretched.
For a meaningful AVAX Liquidity Rally to occur, price must hold current support levels and attract sustained volume.
Liquidity Zones Above Current Price
The most critical factor behind the AVAX Liquidity Rally discussion is the presence of significant upside liquidity. Data shows that a large cluster of liquidation levels sits above the current trading range, particularly between 10 dollars and 12 dollars.
Liquidity clusters form when many traders open leveraged positions. These positions include stop-losses and liquidation points that can trigger automatically once price reaches certain thresholds.
Markets frequently move toward these liquidity pockets. When price approaches such zones, forced liquidations and stop triggers can accelerate volatility.
If AVAX begins moving upward toward the 10 to 12 dollar range, these liquidity concentrations could amplify momentum.
Why Liquidity Drives Volatility
Liquidity acts as fuel for price movement. When a cluster of orders sits above the market, it becomes a potential target. Market makers and large participants are aware of these concentrations.
If price starts pushing upward, short positions may begin to close. As they close, buying pressure increases. This can create a cascading effect where additional liquidations trigger more upward movement.
However, it is important to understand that liquidity works both ways. While upside liquidity exists, failure to reach it could result in continued consolidation or renewed downside.
The presence of liquidity does not guarantee direction. It only highlights where strong reactions may occur.
What Traders Should Watch Next
Volume Confirmation
For the AVAX Liquidity Rally to materialize, rising trading volume is essential. A price move without volume is often unsustainable. Increased volume confirms real participation rather than temporary spikes.
If AVAX approaches key liquidity zones with strong volume, the probability of a sustained move increases.
Reaction at 10 to 12 Dollar Range
The 10 to 12 dollar band is a critical liquidity area. Traders should observe how price behaves if it enters this region.
A strong breakout above this range could trigger cascading liquidations and push price higher. On the other hand, rejection at this zone could signal that sellers remain in control.
Continued On-Chain Strength
Monitoring active addresses and ecosystem inflows remains important. Sustained network growth strengthens the broader outlook and supports the possibility of a structural recovery.
If network activity declines sharply, it could weaken the rally narrative.
Editor’s View: Market Behavior Beyond Liquidity
What liquidity maps do not show is how traders emotionally react after prolonged drawdowns. When an asset falls more than 80 percent from its highs, sentiment often shifts from fear to indifference. That indifference can reduce aggressive selling, which quietly changes the structure of the market before price reflects it. In such phases, even moderate buying pressure can feel larger than it is, not because fundamentals suddenly changed, but because positioning has already been reset.
Final Thoughts on AVAX Liquidity Rally
The AVAX Liquidity Rally setup is built on a combination of liquidity concentration, oversold conditions, and steady on-chain engagement. While price has suffered a significant correction, underlying network activity suggests that Avalanche remains active.
Liquidity clusters above current levels create the potential for sharp movement if triggered. However, confirmation through volume and structural strength is necessary before labeling any move as a true rally.
Traders should remain cautious but observant. Liquidity often precedes volatility. When markets compress under heavy drawdowns while maintaining network engagement, the probability of a decisive move increases.
Whether AVAX pushes into the identified liquidity zones or continues consolidating will determine the next phase. For now, liquidity remains the key variable shaping expectations.
Disclaimer: This content is for informational purposes only and does not constitute financial advice.
Keep yourself updated with the latest crypto news with FYI Gazette
Read more about Memecoins with FYI Gazette
Keep yourself updated with the latest Altcoin News with FYI Gazette
 Bitcoin
  Ethereum
  Tether
  BNB
BNB  XRP
XRP  Solana
  TRON
TRON  Dogecoin
  Litecoin
  Pepe
Pepe