
Altcoin Capital Shift Toward Bitcoin Liquidity
Altcoin Capital Shift is reshaping the crypto landscape as altcoins, excluding Ether, recorded an extraordinary 209 billion dollars in net selling volume over the past 13 months. This sustained imbalance marks one of the sharpest contractions in speculative demand observed in the current market cycle. The scale of selling pressure has significantly exceeded the sell volumes seen during Bitcoin’s prior multi month correction, raising an important question for traders and investors alike. Are market participants rotating capital into Bitcoin, or simply exiting risk assets altogether?
Altcoin Capital Shift Signals Weakening Demand
Market data tracking cumulative buy and sell activity across centralized exchanges reveals the depth of the Altcoin Capital Shift. The cumulative delta for altcoins excluding Bitcoin and Ether reached negative 209 billion dollars, a figure that illustrates persistent net selling rather than temporary volatility. This metric measures net spot demand by comparing executed buy and sell volumes. When readings remain deeply negative, the implication is straightforward. Sellers dominate, while consistent spot buyers are largely absent.
Analysts emphasize that such a large negative delta does not automatically signal undervaluation or a price bottom. Instead, it highlights capital flows and participation trends. Over the last 13 months, altcoin markets have experienced steady outflows without meaningful counterbalancing demand. In practical terms, more capital has left these assets than entered them, reflecting declining speculative interest.
Exchange Activity Reflects the Altcoin Capital Shift
Trading activity on Binance further reinforces the Altcoin Capital Shift narrative. Since November 2025, altcoin trading volumes on the exchange have declined by roughly 50 percent. This reduction points to waning participation rather than isolated selling events. Lower volumes typically indicate reduced trader engagement, thinner liquidity, and weaker momentum across a broad range of tokens.
During the same period, Bitcoin’s share of trading volume increased noticeably. As BTC tested the 60000 dollar level in early February, the distribution of exchange activity shifted. On February 7, Bitcoin accounted for 36.8 percent of total trading volume. By mid February, altcoin volumes had dropped to 33.6 percent, a stark contrast to their November peak of 59.2 percent. This reallocation of volume suggests that traders are concentrating activity in Bitcoin while stepping back from altcoins.
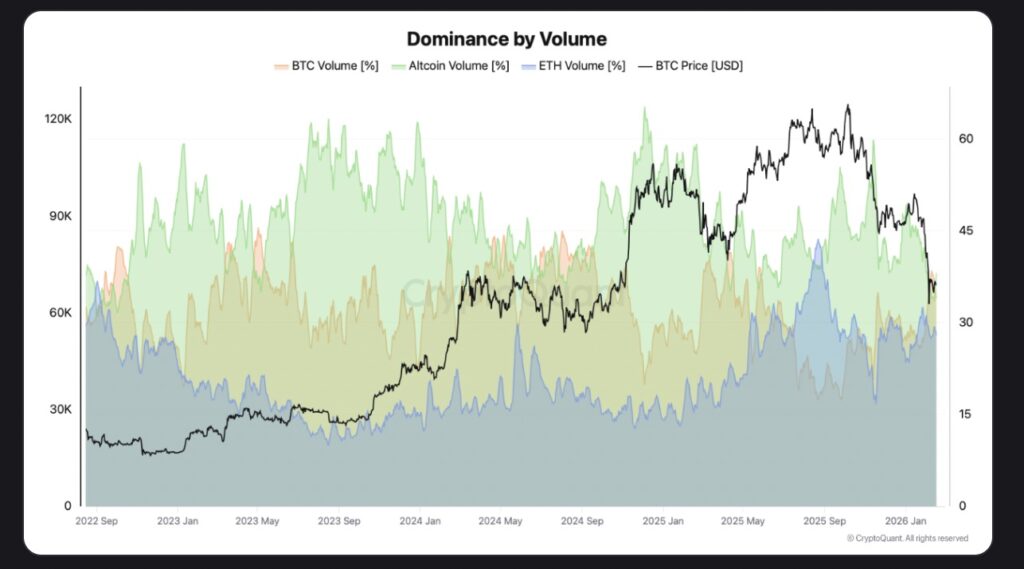
The volume dominance structure illustrated above highlights how capital concentration tends to evolve during corrective phases. Periods where Bitcoin’s share of activity expands while altcoin participation contracts often reflect shifts in trader preference rather than isolated price reactions. Volume distribution can act as a proxy for risk appetite, revealing where liquidity is most actively deployed. While price movements attract attention, changes in trading activity frequently provide earlier clues about market positioning and participant behavior.
Historical Patterns Behind the Altcoin Capital Shift
Similar rotations have occurred during previous market corrections. Analysts point to comparable phases in April 2025, August 2024, and October 2022. In each instance, capital consolidated into Bitcoin as altcoin volumes contracted. These historical parallels imply that the Altcoin Capital Shift may represent a recurring behavioral pattern rather than an anomaly specific to current conditions.
During corrective or uncertain environments, market participants often reduce exposure to higher volatility assets. Bitcoin, with its deeper liquidity and dominant market structure, tends to attract relatively greater interest during these periods. Altcoins, by contrast, frequently experience sharper demand contractions when risk appetite diminishes.
Stablecoin Dynamics Amplify the Altcoin Capital Shift
Stablecoin dominance metrics add another dimension to the Altcoin Capital Shift story. Tether’s USDt market cap dominance recently climbed to the 8 percent level on the one week chart, aligning with historical highs recorded between mid 2022 and late 2023. Rising stablecoin dominance typically indicates that capital is moving into dollar pegged assets rather than being deployed into volatile cryptocurrencies.
This behavior is often interpreted as defensive positioning. Traders may be reducing directional exposure while preserving liquidity and optionality. Elevated stablecoin dominance frequently coincides with periods of market consolidation or uncertainty, as participants hesitate to commit capital aggressively.
Relationship Between Stablecoin Dominance and Bitcoin
Past market cycles reveal a noteworthy relationship between stablecoin dominance and Bitcoin price behavior. During 2022 and 2023, elevated USDt dominance aligned with Bitcoin consolidating near bear market lows. Conversely, declining dominance has historically preceded renewed bullish momentum. While this relationship is not deterministic, it provides a useful framework for interpreting liquidity flows.
Previous lows in USDt dominance formed around the 3.80 to 4 percent range in March 2024, December 2024, and October 2025. These phases coincided with Bitcoin reaching new all time highs near 72000 dollars, 104000 dollars, and 126000 dollars respectively. Such patterns suggest that shifts in stablecoin allocation can reflect broader changes in market sentiment and risk tolerance.
Editor’s View: Altcoin Capital Shift and Trader Behavior
Market rotations rarely unfold as purely mechanical responses to price levels or dominance charts. Extended periods of altcoin underperformance often coincide with subtle shifts in trader psychology, where participants become less willing to allocate capital toward assets perceived as uncertain or illiquid. In these phases, capital preservation tends to override opportunistic positioning, even among experienced market actors. The resulting flow patterns can appear abrupt on charts, yet they often reflect a gradual erosion of conviction rather than a single coordinated move.
Interpreting the Altcoin Capital Shift for Traders
For active traders, the Altcoin Capital Shift highlights the importance of monitoring demand and liquidity rather than focusing solely on price movements. Persistent negative spot demand implies that rallies may lack sustainability without renewed buying pressure. Thin volumes and declining participation can amplify volatility and reduce the reliability of short term trends.
Risk management becomes particularly critical in this environment. Reduced liquidity conditions often increase slippage, widen spreads, and magnify sudden price swings. Traders navigating altcoin markets during such phases typically face greater execution challenges and elevated uncertainty.
Broader Market Implications of the Altcoin Capital Shift
Beyond trading considerations, the Altcoin Capital Shift carries implications for the wider crypto ecosystem. Capital outflows and reduced activity may affect project funding, network usage, and investor confidence across smaller tokens. As liquidity concentrates in Bitcoin and stablecoins, competitive pressures intensify among altcoin projects seeking attention and capital allocation.
At the same time, Bitcoin’s rising share of exchange volume underscores its enduring role as the market’s primary liquidity hub. During periods of contraction or risk aversion, BTC frequently becomes the focal point for both trading activity and capital preservation strategies.
What Comes Next After the Altcoin Capital Shift
Whether the Altcoin Capital Shift reverses or persists will depend largely on changes in market demand and sentiment. A sustained recovery in altcoin spot demand would require consistent buyer participation and expanding volumes. Without these elements, capital concentration trends may continue to favor Bitcoin and stablecoins.
Stablecoin dominance indicators will remain essential signals to watch. Declining dominance has historically aligned with renewed risk taking and expanding crypto market momentum. Conversely, continued elevation may reinforce defensive positioning and selective capital allocation.
The Altcoin Capital Shift ultimately reflects a market navigating uncertainty, liquidity preferences, and evolving risk dynamics. As capital flows adjust, traders and investors must interpret not only price charts but also participation metrics that reveal where conviction and confidence truly reside.
Disclaimer: This content is for informational purposes only and does not constitute financial advice.
Keep yourself updated with the latest crypto news with FYI Gazette
Read more about Memecoins with FYI Gazette
Keep yourself updated with the latest Altcoin News with FYI Gazette
 Bitcoin
  Ethereum
  Tether
  BNB
BNB  XRP
XRP  Solana
  Dogecoin
  Litecoin
  Pepe
Pepe