
Bitcoin Bottom Signal Returns Amid Weak Demand
Bitcoin Bottom Signal has appeared again in 2026, echoing the same setup that formed in 2023 before Bitcoin surged 130 percent in 2024. The signal is typically viewed as a late stage drawdown indicator that suggests the market may be approaching a turning point. However, the broader environment today looks very different from two years ago. Liquidity conditions, ETF flows and inflation trends all suggest that even if a bottom is forming, the recovery may not unfold in the same way.
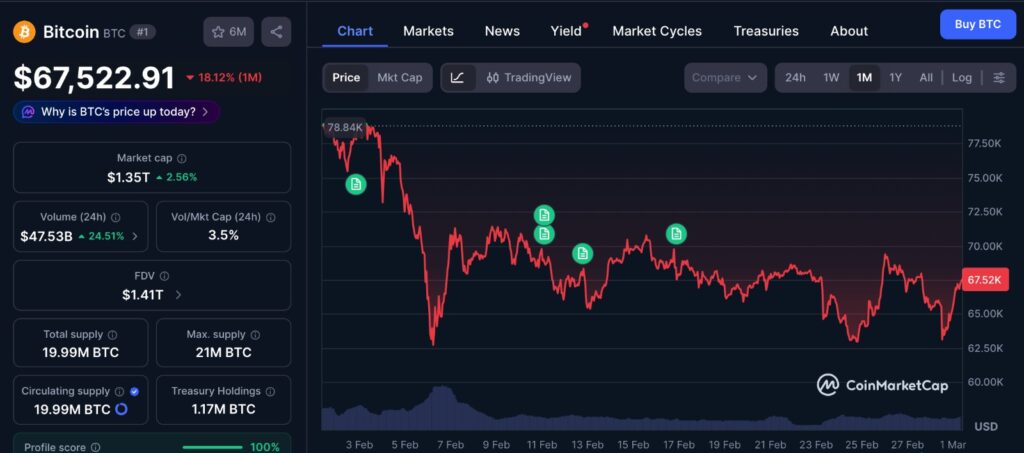
Over the past month, Bitcoin’s price action has reflected the broader uncertainty highlighted by the Bitcoin Bottom Signal. The chart shows periods of attempted recovery followed by renewed selling pressure, reinforcing the idea that momentum remains fragile. While volatility has compressed compared to earlier stages of the drawdown, a decisive shift in trend has not yet materialized. This steady but hesitant structure aligns with the broader data suggesting stabilization rather than confirmed expansion.
Bitcoin Bottom Signal flashes again
The Bitcoin Bottom Signal is closely linked to risk indicators that measure when the market enters extreme stress conditions. Recent data shows Bitcoin has remained in an extreme high risk zone for 25 consecutive days. That is the longest stretch ever recorded and slightly above the previous peak seen in 2023.
Historically, extended time in this zone has aligned with the final phase of major corrections. In past cycles, once the risk level shifted from extreme to lower levels, Bitcoin began a sustained upward move. That is why the current signal is attracting attention from analysts and traders who remember how the 2023 setup led into a powerful rally in 2024.
However, technical similarities alone do not guarantee a repeat performance.
Demand does not confirm the Bitcoin Bottom Signal
One of the main differences this time is the lack of strong buying momentum. Data tracking 30 day apparent demand shows that demand continues to flip between positive and negative. Selling pressure has cooled compared to deeper parts of the drawdown, but steady accumulation has not taken control.
In previous cycles, bottom formations were supported by a clear shift from distribution to accumulation. Buyers stepped in consistently and built momentum. At the moment, that type of follow through is not visible. The Bitcoin Bottom Signal may be flashing, but demand is not fully aligned with a strong breakout.
This creates a more cautious setup. Without sustained buying, any recovery could struggle to gain traction.
Bitcoin drawdowns usually take time
Another factor to consider is how long large corrections typically last. Excluding the sharp rebound during the 2020 crisis, which was supported by aggressive monetary intervention, most 50 percent drawdowns have taken extended periods to recover.
That historical pattern suggests patience may be required. Even if the Bitcoin Bottom Signal identifies a structural low forming, the path back to previous highs could involve months of consolidation and volatility rather than a fast V shaped rebound.
Markets rarely reverse overnight after deep declines. They often build a base before expanding again.
ETF flows show cautious positioning
Exchange traded fund data provides further context. Over recent months, gold ETFs have attracted more cumulative inflows than spot Bitcoin ETFs on a rolling 90 day basis. At the same time, Bitcoin funds have posted negative flows on a 90 day average, currently around minus 2.06 billion dollars.
ETF flows are important because they reflect institutional participation. When capital flows into Bitcoin products, it often supports upward momentum. When flows turn negative, it signals hesitation or risk aversion.
The current rotation toward gold suggests investors are leaning toward defensive assets rather than increasing exposure to crypto. That stands in contrast to earlier bullish phases when strong ETF inflows helped drive price expansion.
Inflation limits liquidity expansion
Inflation data adds another layer of complexity. The Personal Consumption Expenditures index remains close to 2.9 percent year over year. Core PCE sits near 3.0 percent, while core services inflation is above 3.4 percent. Because the Federal Reserve uses PCE as a primary inflation gauge, these readings matter for policy decisions.
Without a clear downward trend in inflation, expectations for aggressive monetary easing remain limited. Liquidity expansion tends to support risk assets like Bitcoin. If policy stays tight, the liquidity tailwind that fueled previous rallies may not materialize quickly.
In 2023 and 2024, improving macro conditions helped amplify technical signals. In 2026, that support looks weaker.
Key price levels to watch
Important price zones help frame the broader outlook. Analysts note that a short term relief rally toward the 70000 to 80000 dollar range could face renewed selling pressure. Liquidity in both spot and futures markets has been deteriorating, reinforcing a cautious tone.
From a structural perspective, 45000 dollars aligns with previous bear market territory. Below that, 30000 and 16000 dollars represent deeper historical support levels connected to long term trend preservation. These levels provide context for how far price could move if downside pressure intensifies.
At the same time, they also represent areas where long term buyers have previously stepped in.
Editor’s View: Why Bottom Signals Alone Do Not Shift Sentiment
Even when technical bottom signals appear, investor behavior rarely turns immediately. After a deep drawdown, participants tend to anchor to recent losses, which slows capital reallocation back into risk assets. Institutions also respond more to liquidity and policy signals than to chart patterns, meaning confidence often rebuilds gradually rather than suddenly. The current hesitation in ETF flows and demand metrics reflects that psychological reset phase, where caution persists even as technical structures begin to stabilize.
Is the Bitcoin Bottom Signal enough
The reappearance of the Bitcoin Bottom Signal naturally raises expectations because of what happened in 2023. Back then, the shift from extreme risk conditions to lower risk coincided with the beginning of a 130 percent rally.
Today, the signal appears in a more challenging environment. ETF flows are negative, inflation remains above target and liquidity conditions are not clearly improving. Demand metrics show stabilization, but not dominance by buyers.
This does not mean a bottom cannot form. It simply means that the signal is operating without the strong macro and capital flow support that existed before the last major rally.
Technical indicators can highlight turning points, but they work best when reinforced by broader economic alignment. In 2026, the Bitcoin Bottom Signal stands as an important data point, yet it is surrounded by mixed evidence.
Whether this marks the foundation for the next expansion phase or just a pause within a broader bearish regime will likely depend on how demand, liquidity and macro trends evolve in the coming months.
Disclaimer: This content is for informational purposes only and does not constitute financial advice.
Keep yourself updated with the latest crypto news with FYI Gazette
Read more about Memecoins with FYI Gazette
Keep yourself updated with the latest Altcoin News with FYI Gazette
 Bitcoin
  Ethereum
  Tether
  XRP
XRP  BNB
BNB  Solana
  Dogecoin
  Litecoin
  Pepe
Pepe