
Bitcoin Run-Up Signals Push Toward $113K Target
Bitcoin Run-Up expectations are rising as traders analyze a classic chart formation that suggests a strong move higher may be approaching. Bitcoin has spent recent weeks consolidating below key resistance levels, and this price behavior is being interpreted as a potential setup for a bullish breakout. According to traders, the current structure closely resembles patterns that have previously led to major upside expansions.
The broader market context shows Bitcoin holding firm above important support zones while volatility remains relatively contained. This type of price compression often precedes a decisive move, and many market participants believe the conditions are aligning for another leg higher.
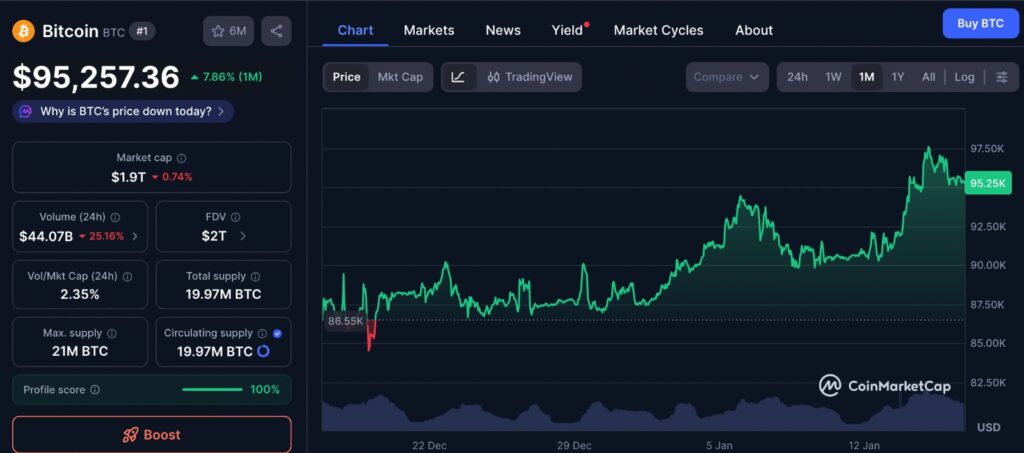
Looking at the past month on the chart, the most notable feature is how Bitcoin’s price has spent more time moving sideways than trending aggressively in either direction. This kind of compression often reflects uncertainty rather than weakness, as buyers and sellers repeatedly test the same zones without committing to a decisive move. The lack of sharp sell-offs during pullbacks suggests that bids continue to appear at familiar levels, even as upside momentum pauses. In practical terms, the chart shows a market that is waiting for clarity, not one that is rushing to exit.
Bitcoin Run-Up Pattern Draws Trader Attention
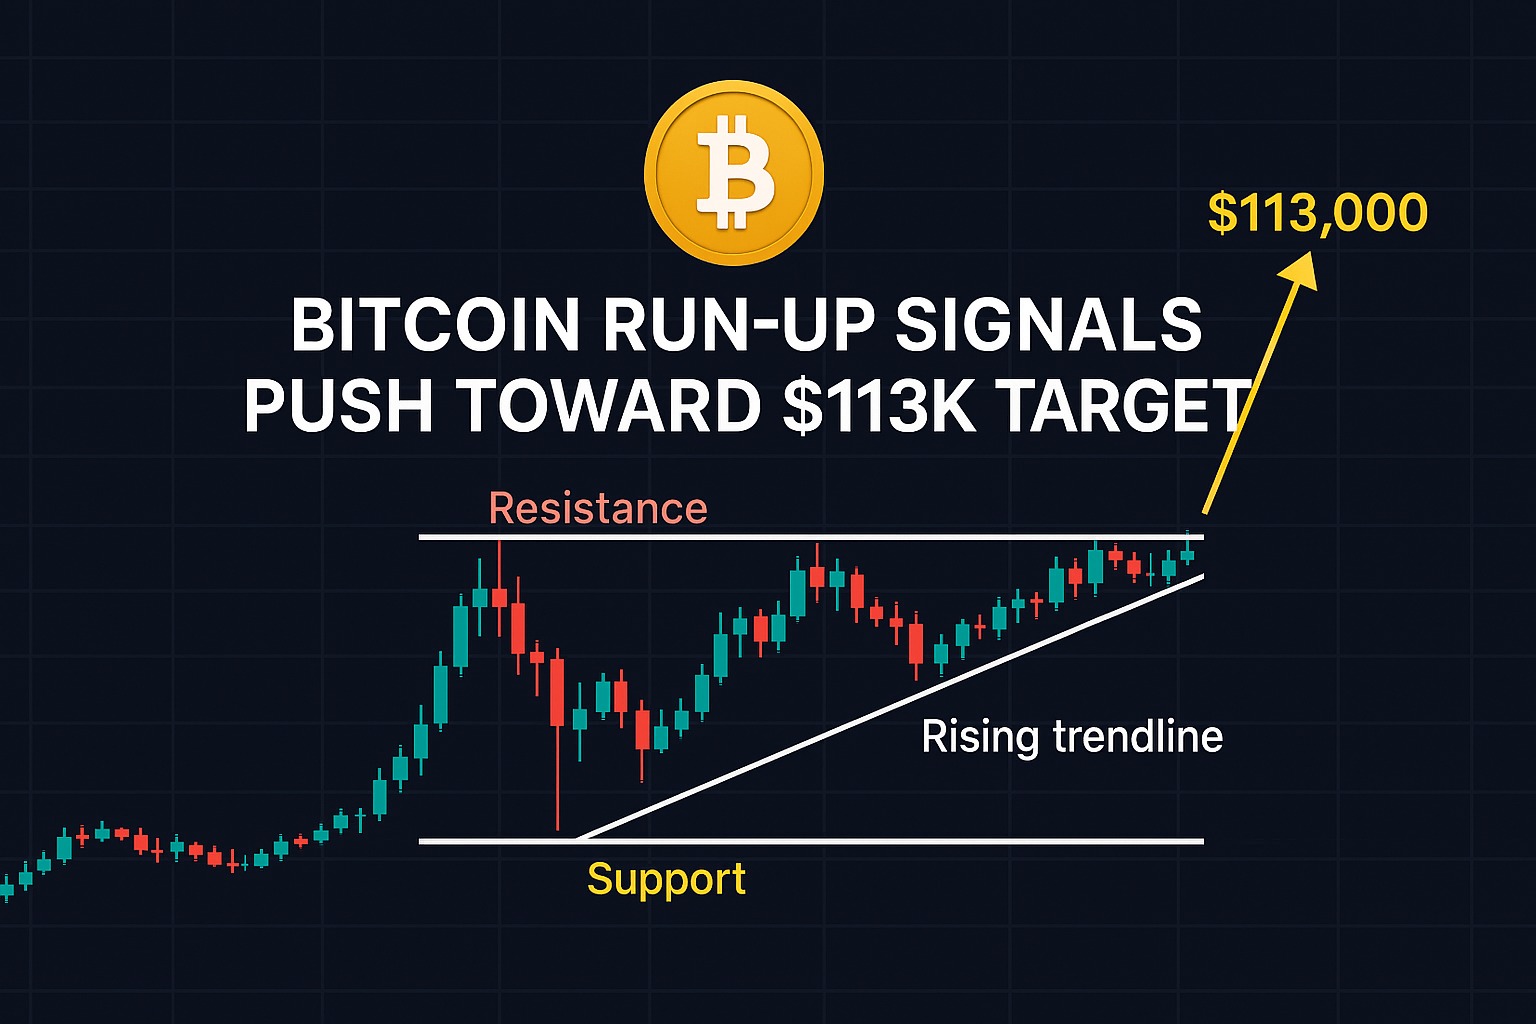
The current Bitcoin Run-Up narrative is largely driven by the formation of an ascending triangle pattern on the daily chart. This pattern is defined by a flat resistance level and a rising support trendline. Over time, price action becomes more compressed as buyers step in at higher levels while sellers defend the same resistance zone.
In Bitcoin’s case, resistance is concentrated just below the $100,000 level, while higher lows continue to form along a rising trendline that has remained intact for several months. This tightening range indicates growing pressure that often resolves with a breakout to the upside.
Traders calculate the potential target of an ascending triangle by measuring the height of the pattern and projecting it upward from the breakout point. Using this method, analysts arrive at a target near $113,000, representing a notable move from current price levels.
Key Levels Supporting the Bitcoin Run-Up Scenario
Several important price levels are reinforcing confidence in the Bitcoin Run-Up thesis. One of the most closely watched levels is the short-term holder cost basis, which sits near $98,000. This level reflects the average entry price of newer market participants.
When price trades above this zone, short-term holders are generally in profit, reducing selling pressure and increasing the likelihood of sustained upward momentum. Traders believe reclaiming and holding this level could act as a catalyst for further gains.
Another critical reference point is the 21-day moving average, which has consistently acted as dynamic support during previous uptrends. Bitcoin remaining above this moving average suggests that bullish momentum is still intact and that pullbacks may be corrective rather than trend-reversing.
Longer-term trendline support that has guided price action since early 2023 also remains unbroken. Each successful test of this trendline in the past has led to renewed rallies, strengthening confidence that the broader bullish structure remains valid.
Technical Indicators Reinforce Bitcoin Run-Up Momentum
Momentum indicators are adding further support to the Bitcoin Run-Up outlook. The Relative Strength Index is trending upward while staying below overbought levels. This suggests that buying pressure is increasing without signaling excessive market exuberance.
In addition, momentum oscillators are showing bullish crossovers, which traders often interpret as early signs of trend continuation. These signals, when combined with strong chart structure, create a confluence that many traders look for before entering or adding to positions.
Volume behavior is also closely monitored. Although volume has been moderate during consolidation, traders expect a surge in trading activity if price breaks above resistance. A breakout accompanied by strong volume would serve as confirmation that buyers are firmly in control.
Market Structure and Sentiment Behind the Bitcoin Run-Up
Beyond technical charts, market sentiment plays a significant role in shaping the Bitcoin Run-Up narrative. Onchain data suggests that larger holders have continued accumulating during periods of consolidation rather than distributing their holdings.
This accumulation behavior is often interpreted as confidence from experienced participants who anticipate higher prices ahead. At the same time, institutional interest remains a supportive backdrop, reinforcing the perception that Bitcoin is still in a longer-term growth phase.
Despite short-term uncertainty, the market has shown resilience following previous pullbacks. This ability to hold higher support levels has contributed to the view that Bitcoin is building a strong base rather than topping out.
Risks That Could Challenge the Bitcoin Run-Up
While the technical outlook remains constructive, traders also acknowledge risks that could delay or invalidate the Bitcoin Run-Up scenario. The most immediate risk is repeated rejection near the $100,000 psychological level. Failure to break through resistance after multiple attempts could weaken bullish conviction.
Another concern is sudden increases in volatility driven by macroeconomic developments or shifts in risk sentiment. Unexpected events can trigger sharp moves that override technical setups, even well-defined ones.
Additionally, some analysts caution that Bitcoin could still experience a deeper pullback before resuming its upward trend. Such a move would not necessarily invalidate the broader bullish structure, but it could test trader patience and shake out leveraged positions.
Editor’s View: Why This Phase Feels Different
What stands out in the current Bitcoin Run-Up discussion is not the pattern itself, but how traders are behaving around it. Instead of aggressive positioning, there is a noticeable hesitation near resistance, suggesting participants are more concerned with confirmation than anticipation. This often happens after extended rallies, when market memory of past false breakouts is still fresh. In these moments, price action becomes as much about managing expectations as it is about technical levels, and that restraint can quietly shape how the next move develops.
What Traders Are Watching Next
Looking ahead, traders are focused on whether Bitcoin can decisively break above resistance and hold above key support levels. A confirmed breakout would strengthen the Bitcoin Run-Up thesis and bring the $113,000 target into clearer view.
Until then, consolidation and short-term volatility are expected as buyers and sellers continue to battle near critical price zones. Traders emphasize the importance of confirmation rather than anticipation, waiting for clear signals before declaring the next major move underway.
In summary, the Bitcoin Run-Up outlook is supported by a classic chart pattern, strong technical indicators, and resilient market structure. While risks remain, many traders believe that the current setup has the potential to deliver another significant upside move if key levels are reclaimed and sustained.
Disclaimer: This content is for informational purposes only and does not constitute financial advice.
Keep yourself updated with the latest crypto news with FYI Gazette
Read more about Memecoins with FYI Gazette
Keep yourself updated with the latest Altcoin News with FYI Gazette
 Bitcoin
  Ethereum
  Tether
  XRP
XRP  BNB
BNB  Solana
  Dogecoin
  Litecoin
  Pepe
Pepe