
Chainlink Recovery Surges 30 Percent But Upside Is Limited
Chainlink posted an impressive rebound this week, and Chainlink has recovered nearly 30 percent after Monday’s steep market-wide decline. While the rally lifted sentiment and pushed LINK back above several key levels, the current structure suggests that the upside may be capped in the near term. Both short and long-term charts highlight mixed signals, leaving traders cautious rather than fully confident in a continued breakout.
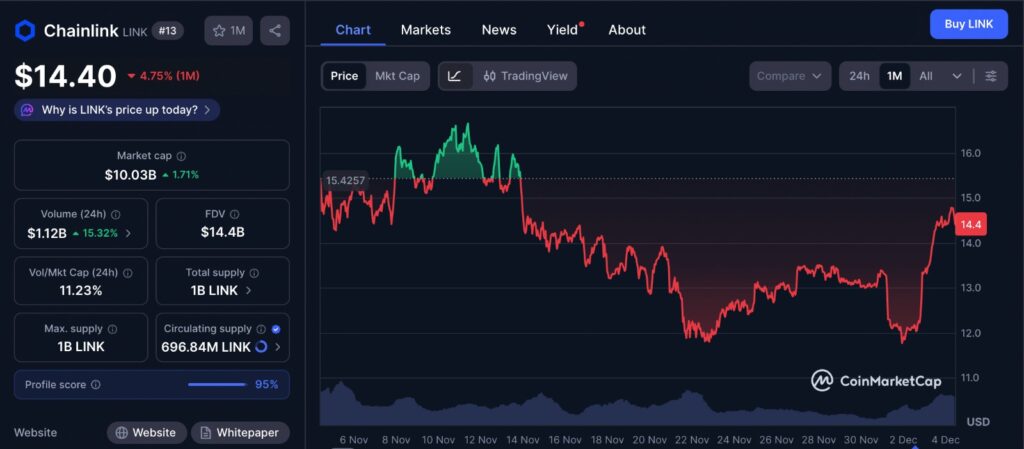
The latest one-month chart from CoinMarketCap provides additional context for Chainlink’s recent movements. The visual trend clearly reflects the sharp drop seen during Monday’s broader market correction, followed by the strong rebound that pushed LINK back toward the mid-$14 range. The chart also highlights how price has struggled to maintain momentum near the upper resistance zones, aligning with the current view that upside may be limited unless buying pressure strengthens. Overall, the one-month performance reinforces the short-term recovery while still showing the broader consolidation pattern that has defined LINK’s recent trading structure.
Chainlink’s Sharp Drop And Strong Rebound
Chainlink entered last week with growing optimism after ETF-related discussions and an increase in spot buying activity fueled a 15 percent surge in under six days. This upward push carried LINK to 13.57, marking a meaningful climb from earlier lows. However, the momentum was short-lived as Monday’s broader market dip erased all of those gains.
During the sell-off, LINK fell to 11.74, hitting a key support level as fear returned across the crypto market. But much like its earlier rallies this year, Chainlink reacted strongly to the drop. From that low, it bounced by 24.4 percent, climbing back to 14.61 at the time of writing. This quick response restored short-term bullish structure, even though the larger trend remains uncertain.
Chainlink’s Long And Short-Term Trend Structure
Breaking Past The Lower High At 13.57
On the daily chart, Chainlink improved its internal structure by breaking above the previous lower high of 13.57. This move signals a short-term shift toward bullishness. Still, the broader trend remains bearish, as the market has yet to reclaim the upper supply levels necessary for a sustained reversal.
A major supply zone sits between 15.00 and 16.60. For LINK to move into a stronger upward trend, this area must flip into support. Until that happens, any upside push may face immediate resistance and could stall quickly.
To the downside, long-term supports remain at 11.74 and 10.94, two levels that helped stabilize price during earlier sell-offs.
Momentum Indicators Show Mild Buying Pressure
The on-balance volume (OBV) on the daily timeframe has been slowly trending higher, showing some buyer presence but not enough to indicate explosive demand. This means traders should be cautious about expecting an immediate move beyond 16.60. The Relative Strength Index shows a reading of 54, reflecting a mild shift toward bullish momentum but not a strong trend reversal.
Chainlink Short-Term Charts Suggest A Possible Pullback
Bullish Momentum With A Bearish Divergence
Zooming into the one-hour chart, Chainlink displays stronger bullish momentum. Both price action and the RSI show upward movement, indicating that buyers have maintained control in the short term.
However, the RSI also shows a bearish divergence relative to the rising price. This typically signals that momentum may be weakening, even if price continues upward briefly. As a result, a minor pullback appears likely.
Local Support At 14.20
If this pullback materializes, LINK could revisit the nearby support at 14.20. This level has acted as a stabilizing point on intraday charts and may help absorb selling pressure before any renewed upward attempts.
Liquidity Zones And Their Influence On Price
Liquidation heatmap data shows that Chainlink recently swept through several key liquidity zones between 13.60 and 15.00. These areas attracted liquidations and helped fuel the recent move upward. While additional short liquidations exist above the current price, they are not densely concentrated.
This means there are still liquidity pockets that could drag LINK slightly higher. However, the lack of dense liquidity clusters also means the market may not have a strong directional push in the immediate future.
What Chainlink Needs For A Bullish Scenario
For Chainlink to move beyond the current ceiling, buying pressure must become more pronounced. The OBV trend would need to strengthen significantly, showing that buyers are stepping in with conviction rather than mild accumulation.
If that happens, LINK could attempt a rally toward the 16.00 to 16.60 region. Breaking above 16.60 and flipping it into support would mark a meaningful shift and could open the door for a broader bullish trend.
However, until OBV shows stronger momentum and the price pushes past major supply, expectations should remain measured.
Why A Range Formation Is The Most Likely Outcome
Market conditions suggest that the most realistic scenario in the near term is a range-bound movement. Based on current data, LINK is likely to fluctuate between approximately 14.20 and 15.40.
These levels are not exact but represent a reasonable zone where traders may see consolidation. Buying pressure and overall trading volume have not been overwhelming during the recovery, which makes a sideways movement more probable than a breakout.
The short-term bearish divergence on the RSI also reduces the likelihood of a quick move past 16.60. Combined with the recent clearance of several liquidity pockets, the market may need more time before committing to a major directional push.
Final Thoughts
Chainlink retraced all of its prior weekly gains during Monday’s sharp drop but has since surged by nearly 30 percent. This strong rebound improved short-term indicators, yet the broader picture still shows resistance ahead.
Despite bullish momentum on shorter timeframes, the market’s overall structure suggests that a consolidation phase is more likely than an immediate breakout. Until stronger volume, clearer liquidity support, and a decisive flip of resistance levels occur, LINK traders should prepare for range-bound price movement rather than expecting a sustained rally.
Keep yourself updated with the latest crypto news with FYI Gazette
Read more about Memecoins with FYI Gazette
Keep yourself updated with the latest Altcoin News with FYI Gazette
 Bitcoin
  Ethereum
  Tether
  XRP
XRP  BNB
BNB  Solana
  Dogecoin
  Litecoin
  Pepe
Pepe