
Dash Surge: How High Can It Go?
Dash Surge has become a central topic in crypto discussions as analysts notice strong similarities between Dash’s current chart and the technical structure that led Zcash to a huge breakout earlier this year. The big question now circulating among traders is simple: can Dash replicate Zcash’s move and stage its own massive surge?
This article examines how the Dash Surge pattern developed, why analysts believe it may mirror Zcash’s path, the potential upside targets, and the risks involved if the pattern fails.
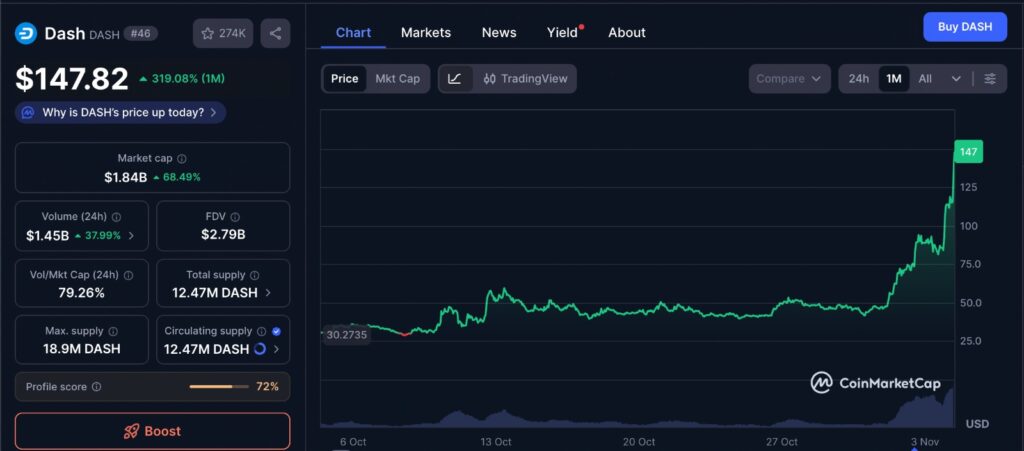
The latest market data from CoinMarketCap shows Dash’s price movement over the past month, offering a snapshot of its current momentum. The chart highlights how Dash has been consolidating after brief upward spikes, suggesting traders are positioning ahead of a potential breakout. This one-month view visually supports the Dash Surge narrative, as price action appears to be tightening near the upper range of its long-term channel. Observing volume trends and short-term fluctuations in this chart helps investors understand whether buying pressure is building before the next major move.
The Setup Behind the Dash Surge
The term Dash Surge refers to the growing belief that Dash is following a nearly identical price structure to Zcash before its major breakout. In late September, Zcash broke above a multi-year descending channel that had held prices down since 2017. Once it broke through resistance, Zcash’s price exploded by over 600% in just a few weeks.
Now, Dash’s chart appears to be replaying the same script. It is currently testing the upper boundary of its long-term descending channel, a position Zcash once occupied before its breakout. Analysts note that Dash’s relative strength index (RSI) and moving average levels match Zcash’s setup just before the latter took off.
This comparison has fueled excitement that a Dash Surge could be next. Traders are closely watching for confirmation of a breakout that could trigger a similar wave of gains.
Technical Indicators Supporting the Dash Surge
Several technical factors strengthen the Dash Surge argument:
- Descending Channel: Like Zcash, Dash has spent years within a downward sloping channel. Breaking above that line would be a major bullish event.
- Fibonacci Levels: Analysts highlight the 0.236 Fibonacci retracement level as a potential target, near the $98 mark. That level would represent a roughly 400% rise from Dash’s current price area.
- Moving Averages: Zcash flipped its 200-week exponential moving average from resistance to support right before it surged. Dash now sits near that same key point.
- RSI Momentum: Dash’s RSI is hovering around 78, indicating strong buying pressure but still lower than where Zcash’s RSI was when its breakout began. That suggests there could still be room to move higher.
All these elements together paint a scenario where a confirmed breakout above the channel could unleash a strong rally, potentially validating the Dash Surge narrative.
How High Could the Dash Surge Go?
If Dash truly follows Zcash’s roadmap, the potential target would sit around the $98 area. This level coincides with the upper Fibonacci resistance and the next major structural barrier on the chart.
A move to $98 would translate to around a 400% increase from current levels, roughly mirroring Zcash’s earlier 634% rise. Analysts emphasize, however, that while the setup looks promising, success depends entirely on a clear breakout with strong volume.
If Dash can replicate Zcash’s momentum, it would be one of the most significant privacy-coin rallies in recent years. The Dash Surge could also attract renewed attention to older coins that have spent years in decline but still maintain active development and user bases.
Risks That Could Stop the Dash Surge
Every bullish setup has a risk side, and the Dash Surge pattern is no exception. Analysts warn that Dash has tested this same upper channel boundary several times in the past, in 2018, 2021, and 2022, only to be rejected each time. Those failures led to corrections of between 85% and 97%.
If history repeats and the breakout fails, Dash could first slide back toward the $69 level, marking a 20% short-term decline. A deeper pullback could send it down to the 50- or 20-week exponential moving averages around $34.
In a worst-case scenario, the price might revisit the channel’s lower boundary between $14 and $16 by 2026. That outcome would mirror earlier cycles where failed breakouts preceded prolonged declines.
Because of this, traders are urged to approach the Dash Surge with caution and apply proper risk management rather than chasing potential upside blindly.
Key Levels to Watch in the Dash Surge
To track whether the Dash Surge is playing out, analysts recommend monitoring several indicators and levels:
- Channel Breakout: A confirmed close above the descending trendline would mark the official start of the surge.
- Volume: Sustained high trading volume would validate breakout strength.
- Support Levels: The $69 zone is the first critical support if Dash retraces. Deeper support sits near $34 and $16.
- RSI and Momentum: If RSI continues to climb while maintaining healthy consolidation, it signals buyer strength.
Keeping an eye on these levels will help traders distinguish between a temporary spike and a genuine breakout.
Broader Meaning of the Dash Surge for Privacy Coins
The Dash Surge scenario also carries implications beyond just one token. Both Dash and Zcash belong to the class of privacy-focused cryptocurrencies that saw massive popularity in 2017 but lost momentum afterward.
If Dash manages to replicate Zcash’s performance, it could revive broader interest in the privacy-coin market. It might also demonstrate that older assets with strong fundamentals can still stage powerful recoveries when technical conditions align.
Moreover, the Dash Surge narrative could serve as a blueprint for identifying other coins locked in long-term downtrends but showing signs of accumulation and breakout potential.
Conclusion: The Opportunity and Risk of the Dash Surge
In summary, Dash Surge represents both a significant opportunity and a major test for Dash. The pattern suggests Dash could rally as much as 400% if it follows Zcash’s trajectory and confirms a clean breakout above its descending channel.
At the same time, the risks are clear: repeated rejections from the same resistance in the past have resulted in steep declines. A failure this time could drag Dash down to much lower support levels, undoing months of progress.
Ultimately, whether the Dash Surge becomes a historic breakout or another false start depends on market confirmation and momentum. For now, analysts agree that Dash’s technical position is one of the most interesting setups in the altcoin space. As always, traders should research carefully, watch the signals closely, and remember that even the strongest chart patterns carry uncertainty.
Keep yourself updated with the latest crypto news with FYI Gazette
 Bitcoin
  Ethereum
  Tether
  XRP
XRP  BNB
BNB  Solana
  Dogecoin
  Litecoin
  Pepe
Pepe