
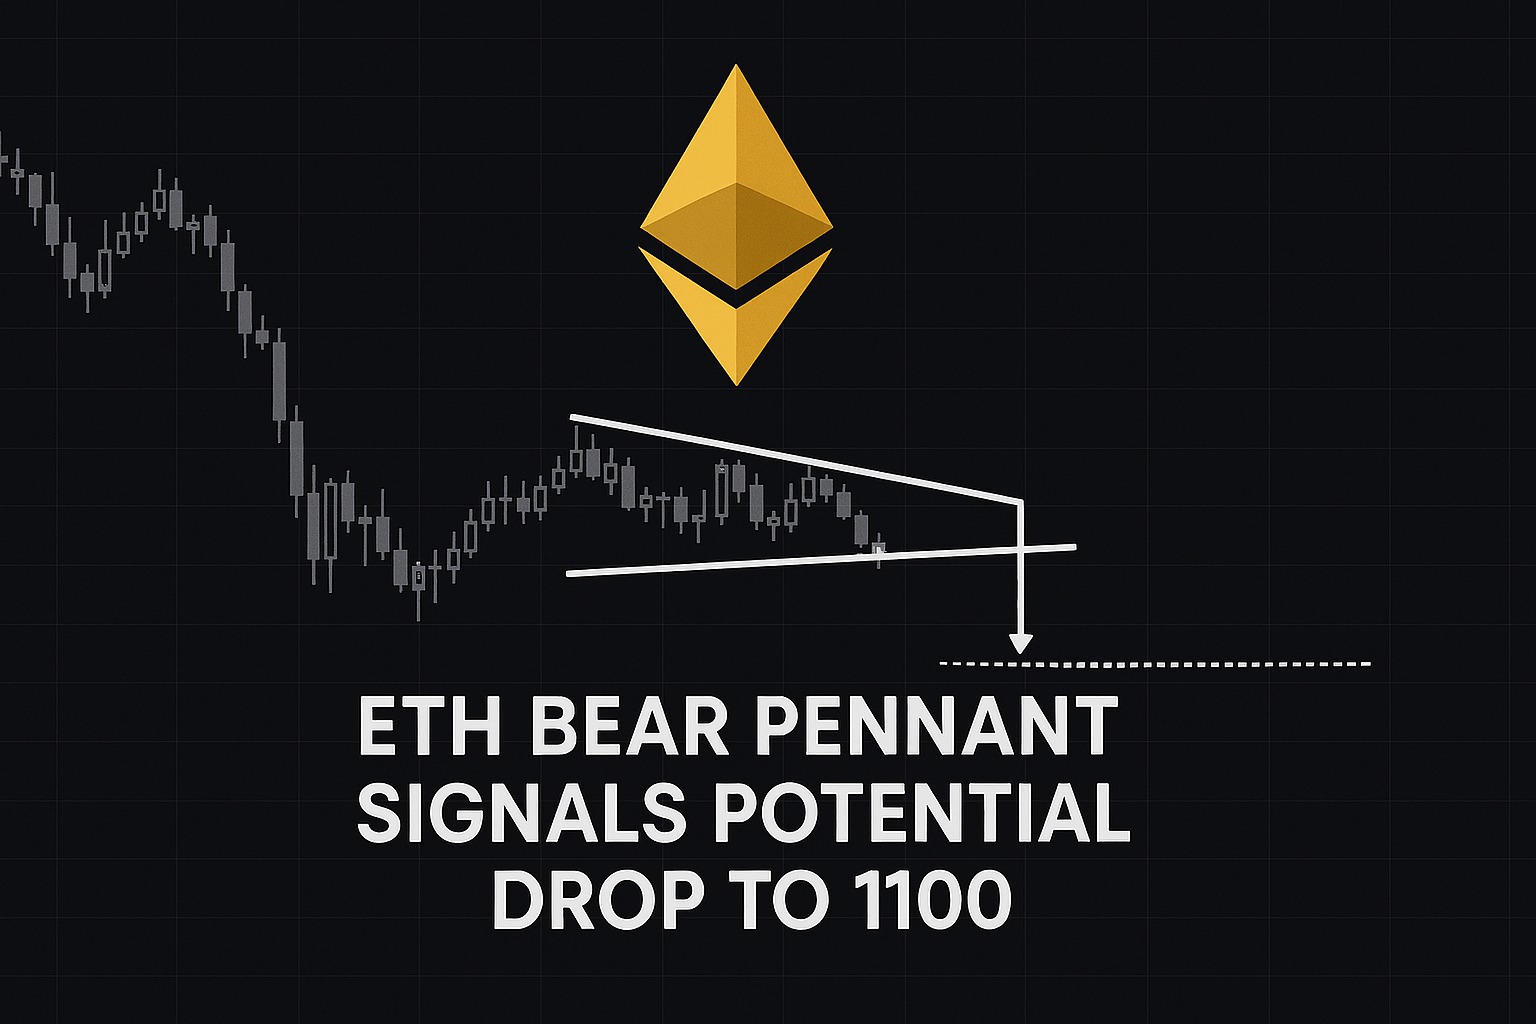
ETH Bear Pennant Signals Potential Drop to 1100
ETH Bear Pennant patterns are drawing renewed attention as Ethereum shows signs of technical weakness combined with declining network activity. Recent price behavior on the daily chart indicates a bearish continuation structure that could expose ETH to deeper losses. While market participants continue debating Ethereum’s long term outlook, both technical and onchain indicators suggest that bears may still have the upper hand in the short term.
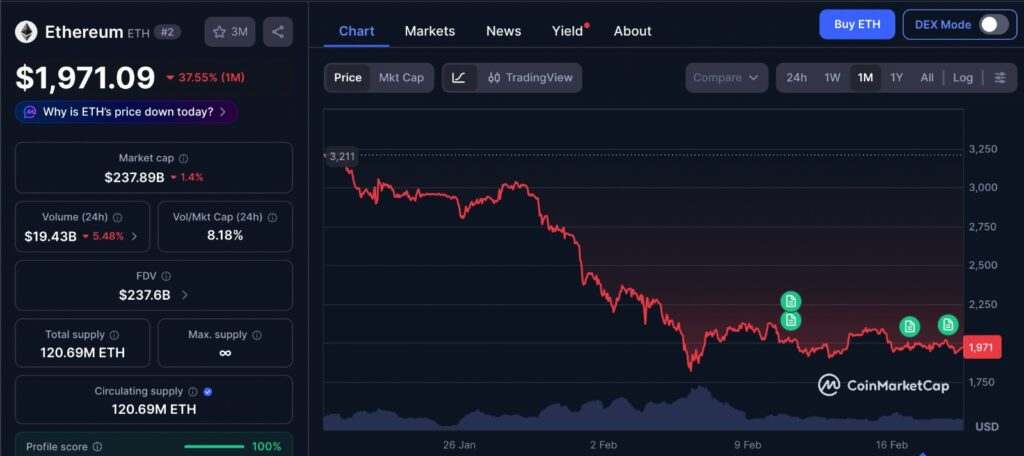
The one month price structure provides useful context for the broader discussion around the ETH Bear Pennant formation. Short term charts often reveal how sentiment evolves in stages, with sharp directional moves followed by periods of compression and reduced momentum. Over this timeframe, price behavior tends to reflect reactions to liquidity conditions and positioning adjustments rather than purely fundamental developments. Observing how ETH responded to rallies, pullbacks, and consolidation zones during the month can help frame the current technical setup without overemphasizing any single indicator.
Understanding the ETH Bear Pennant Formation
The ETH Bear Pennant pattern is a classic technical setup that often appears during strong downtrends. It typically forms after a sharp price decline, followed by a period of consolidation within an upward sloping triangle. This consolidation phase reflects temporary balance between buyers and sellers before the prevailing trend resumes.
In Ethereum’s case, the pattern emerged on the daily chart after a noticeable drop, with price compressing inside the pennant structure. The key level to watch is the lower trend line near 1950. A confirmed break below this zone could activate the bearish continuation scenario.
Technical analysis principles suggest that once the support boundary fails, price may decline by an amount comparable to the height of the previous downward move. Applying this measured move projection places Ethereum’s potential downside target near the 1100 level. Such a move would represent a significant decline from current prices.
Why the 1100 Target Matters
The projected 1100 level is not arbitrary. It is derived from the measured move methodology commonly used in chart analysis. When bear pennant formations resolve lower, markets often travel distances proportional to prior impulse moves.
A decline toward 1100 would imply a drop of roughly 43 percent from the price region discussed in the analysis. This magnitude highlights the importance of monitoring confirmation signals rather than assuming immediate continuation. Bearish patterns require validation through decisive breakdowns and sustained selling pressure.
At the same time, traders remain cautious about false breakdowns, which can occur when price briefly dips below support before reversing. For this reason, volume behavior and broader market context become critical factors.
ETH Bear Pennant and Key Support Levels
Support zones play a central role in determining whether bearish structures remain valid. Market analyst Crypto Patel emphasized that Ethereum must hold the 1800 level to invalidate the ETH Bear Pennant scenario. If price stabilizes above this region, the bearish continuation thesis weakens considerably.
Conversely, failure to defend 1800 could strengthen the case for further downside. Support breakdowns often trigger cascading effects as stop losses are activated and short sellers increase exposure. This dynamic can accelerate price movements once critical thresholds are breached.
Understanding these levels allows traders to frame risk more effectively rather than reacting emotionally to volatility.
Ethereum Onchain Activity Shows Weakness
Beyond price charts, Ethereum’s network metrics reveal additional concerns. Daily transaction counts have declined sharply, falling to 1.95 million from 2.9 million earlier in the month. This reduction of approximately 33 percent indicates a notable slowdown in network usage.
Historical comparisons add context. A similar contraction in transaction activity was observed in January 2024, coinciding with a substantial price correction. While past performance does not guarantee future outcomes, such parallels often attract attention from analysts assessing market conditions.
Lower transaction volumes may signal reduced user engagement, weaker demand for block space, or declining speculative activity. Each of these factors can contribute to softer price dynamics.
Total Value Locked Decline Adds Pressure
Ethereum’s Total Value Locked metric further reflects weakening network participation. TVL dropped from 70 billion to 54.5 billion within a relatively short period, marking a decline exceeding 22 percent. This shift suggests capital outflows from decentralized applications and smart contracts.
Several major protocols recorded notable decreases in deposits. Uniswap saw a reduction of 26 percent, while Ether.fi and EigenLayer experienced declines of 35 percent. Such movements indicate that liquidity providers and yield seekers may be reducing risk exposure.
TVL trends are closely watched because they often represent confidence in decentralized finance ecosystems. Sustained declines can coincide with cautious sentiment across the broader market.
Decentralized Exchange Volume Weakens
Trading activity across Ethereum based decentralized exchanges also contracted significantly. Daily DEX volume fell to 1.5 billion from 3.72 billion during the same period. This sharp drop highlights reduced speculative and transactional activity within the ecosystem.
Declining exchange volumes can have multiple implications. They may signal lower trader participation, reduced volatility, or shifting interest toward other networks. In bearish contexts, falling volumes sometimes accompany weakening demand, reinforcing downward pressure.
However, volume interpretation requires nuance. Extremely low volumes during consolidation phases may precede large directional moves once momentum returns.
Investment Flows Reflect Bearish Sentiment
Global Ethereum investment products recorded net outflows totaling 85.1 million over several days. Capital exiting investment vehicles can reflect cautious institutional sentiment or portfolio rebalancing strategies.
While outflows alone do not dictate price direction, they contribute to the broader narrative of reduced demand. Combined with technical weakness and declining onchain activity, these flows may strengthen bearish interpretations.
Market participants often analyze such data to gauge shifts in investor confidence rather than relying solely on price movements.
Could 1100 Become a Major Opportunity
The question of whether a dip toward 1100 would represent a generational buying opportunity remains inherently subjective. From a risk perspective, large corrections sometimes create attractive entry points for long term investors who maintain strong conviction in Ethereum’s fundamentals.
Yet it is important to distinguish between potential value and timing certainty. Bearish momentum can persist longer than expected, and attempting to catch falling markets carries significant risk. Traders and investors typically look for stabilization signals, trend reversals, and improving network metrics before declaring major bottoms.
Editor’s View: Market Behavior Behind the Pattern
Technical patterns often create an illusion of precision, but markets rarely move on structure alone. In periods like this, price formations tend to reflect positioning stress more than collective conviction, especially as traders react to recent losses rather than fresh information. A bear pennant can just as easily represent hesitation as it can continuation, since participants are constantly recalibrating risk instead of expressing clear directional belief. What charts do not fully capture is the gradual shift in sentiment, where caution builds quietly and liquidity thins before any decisive move becomes obvious.
Final Thoughts on the ETH Bear Pennant
The ETH Bear Pennant structure, combined with weakening Ethereum network indicators, paints a cautious short term picture. A breakdown below critical support could open the path toward lower price targets, while successful defense of key levels may invalidate bearish scenarios.
For market participants, the focus remains on confirmation, risk management, and disciplined decision making. Volatility is a defining feature of crypto markets, and interpreting signals within a broader framework is essential for navigating uncertainty.
Disclaimer: This content is for informational purposes only and does not constitute financial advice.
Keep yourself updated with the latest crypto news with FYI Gazette
Read more about Memecoins with FYI Gazette
Keep yourself updated with the latest Altcoin News with FYI Gazette
 Bitcoin
  Ethereum
  Tether
  BNB
BNB  XRP
XRP  Solana
  Dogecoin
  Litecoin
  Pepe
Pepe