
ETH Price Drop Opens $7B Short Squeeze Window
ETH Price has once again captured attention after dropping sharply to nearly $3,000, triggering heavy liquidations and opening the door to a potential $7 billion short squeeze if the cryptocurrency market regains momentum.
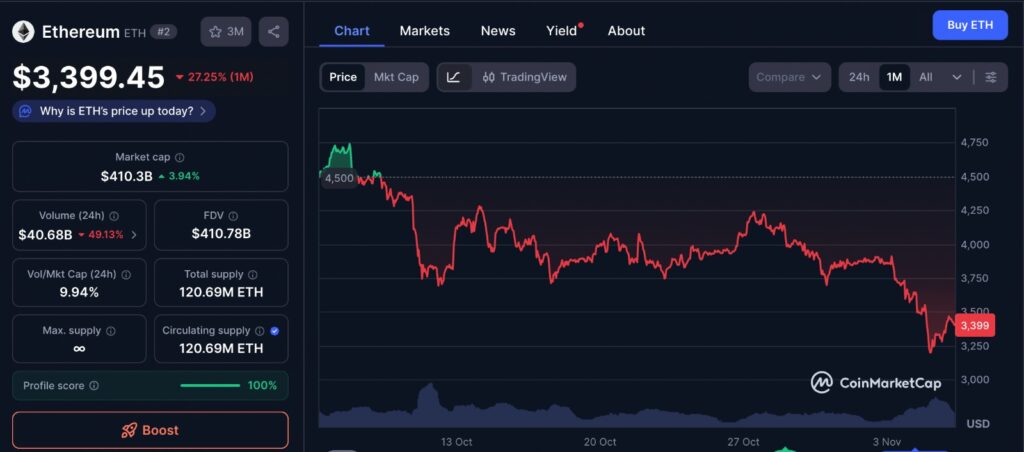
The latest ETH Price data from CoinMarketCap shows that Ethereum has traded within a volatile one-month range between roughly $2,950 and $3,600. The chart reflects a clear downtrend during the first half of the month, followed by short-term consolidation as traders reassess market direction. This recent pattern highlights how Ethereum continues to mirror broader crypto market sentiment—recovering slightly after each major sell-off but still facing resistance near the upper $3,500 levels. The one-month chart underscores both the pressure on ETH in a cautious market and the potential for a sharp rebound if momentum returns.
ETH Price plunges toward $3,000
In early November, the ETH Price fell to about $3,055, marking a weekly loss of more than 13 percent. The move followed a broader market correction affecting most major digital assets. According to data from CoinGlass, over $1.3 billion worth of leveraged long positions were liquidated across exchanges in just 24 hours. On Binance alone, more than $39 million in ETH longs were wiped out during the selloff, making it one of the largest single-day liquidation events since early October.
This sharp decline erased a key liquidity pocket near $3,400 where traders had placed significant long exposure. Clearing this area may have reset the market and prepared the stage for new directional momentum in either direction.
Why the ETH Price correction happened
Analysts point to a combination of profit-taking, technical exhaustion, and a rising U.S. dollar as the main catalysts behind the ETH Price decline. After months of steady gains, many short-term traders took profits near $3,800, while the overall crypto market sentiment turned cautious.
Moreover, Ethereum’s network activity has slowed slightly in recent weeks, reducing fee revenue and adding to pressure on price. Yet, the current zone around $3,000–$2,800 now represents an area of historical support where buyers have stepped in before.
ETH Price shows hidden bullish divergence
Despite the selloff, some on-chain and technical indicators suggest the move may be losing strength. A “hidden bullish divergence” appeared on the daily chart, where the Relative Strength Index (RSI) maintained equal lows even as price made lower lows. In trading terms, this means momentum is no longer falling as fast as price, often a sign that sellers are running out of steam.
If the pattern plays out, ETH Price could rebound from the $3,000 support zone and begin targeting higher levels, provided that broader market sentiment stabilizes.
The $7 billion short squeeze potential
Perhaps the most notable detail from recent market data is the buildup of more than $7 billion in short positions hovering near the $4,000 price level. If ETH Price stages even a modest rally, these short sellers may be forced to buy back their positions to avoid losses, a chain reaction known as a short squeeze.
Such a squeeze could drive prices upward quickly, especially if accompanied by renewed spot demand or improved risk appetite across the crypto sector. The combination of deep support and heavy short positioning makes this a potentially explosive setup.
Market cycle and accumulation phases
Crypto analysts at CryptoQuant outlined that Ethereum has recently gone through several classical market phases: decline, accumulation, markup, and distribution. In 2024, ETH Price experienced each stage in turn.
- During the decline phase, ETH broke below multiple Anchored Volume-Weighted Average Price (AVWAP) levels anchored to major prior highs.
- The accumulation phase followed between $2,000 and $3,000, lasting nearly ten weeks as traders built long positions.
- The markup phase began when ETH surged beyond $3,500, lifting optimism across the ecosystem.
- The distribution phase emerged as price struggled near $4,000, signaling weakening buyer strength.
Now, ETH Price appears to be testing those same AVWAP supports again, suggesting a possible end to the current correction if buying interest returns.
Key ETH Price levels to monitor
- Support zone: $3,000 down to $2,800 remains the primary area to watch for potential rebounds.
- Resistance: Around $4,000 sits a dense cluster of short orders, creating the setup for a potential squeeze if price pushes higher.
- Intermediate zone: The $3,400 region, previously a liquidity pocket, could act as the first major resistance on any recovery attempt.
These zones will likely define whether the next move is a continuation of the decline or the start of a reversal.
Sentiment and trader outlook
Many traders now view the ETH Price correction as a “necessary reset.” The liquidation of overleveraged longs has cleaned up the derivative landscape, paving the way for a healthier structure. If ETH holds above $3,000, confidence could return rapidly.
However, analysts caution that momentum is fragile. If Bitcoin continues to struggle, Ethereum may also face additional downside pressure. Some traders believe ETH could “chop sideways” between $2,800 and $4,000 for weeks before breaking decisively in either direction.
What could invalidate the bullish setup?
Despite growing optimism, several factors could derail the potential short squeeze. A renewed wave of selling pressure could push ETH below $2,800, triggering another round of liquidations and damaging market confidence.
Macroeconomic conditions also remain a wild card. Rising interest rates or unexpected regulatory news could dampen risk sentiment across the entire crypto market. Additionally, the hidden bullish divergence could fail if volume and momentum do not pick up soon.
The path ahead for ETH Price
If ETH Price stabilizes and begins to climb, the first upside target sits near $3,400, followed by $4,000, where that $7 billion short wall resides. A strong breakout above that level could unleash rapid gains, forcing shorts to cover in large numbers.
Conversely, if the $3,000 support breaks decisively, bears could regain control, pushing the token toward deeper retracement zones. Traders should watch for confirmation signals such as volume spikes, RSI reversal, or reclaiming key AVWAP lines to gauge the next major move.
Conclusion: ETH Price primed for volatility
The ETH Price decline to around $3,000 has created both risk and opportunity. On one hand, it reflects the clearing of excess leverage and a cautious market mood. On the other, it has built the foundation for a potentially powerful short squeeze if conditions align.
With over $7 billion in short positions stacked above current levels, Ethereum’s next big move could be dramatic. Whether it materializes as a bullish breakout or continued consolidation will depend on how the market reacts around its key support zone.
For now, traders are watching the $3,000 level closely, a line that may determine whether ETH’s next chapter begins with recovery or deeper correction.
Keep yourself updated with the latest crypto news with FYI Gazette
 Bitcoin
  Ethereum
  Tether
  XRP
XRP  BNB
BNB  Solana
  Dogecoin
  Litecoin
  Pepe
Pepe