
Ether Price Indicators Signal Move Toward $2.4K
Ether Price Indicators right now are revealing more about restraint than momentum, where the absence of aggressive positioning is shaping price as much as any visible trend. What stands out is how both sides of the market are withholding conviction, creating a structure where movement is delayed not by opposition, but by hesitation. This often happens after repeated failed attempts at higher levels, where participants begin to prioritize confirmation over anticipation. The result is a market that appears stable, but is actually defined by selective engagement, where capital waits for alignment rather than reacting to isolated signals.
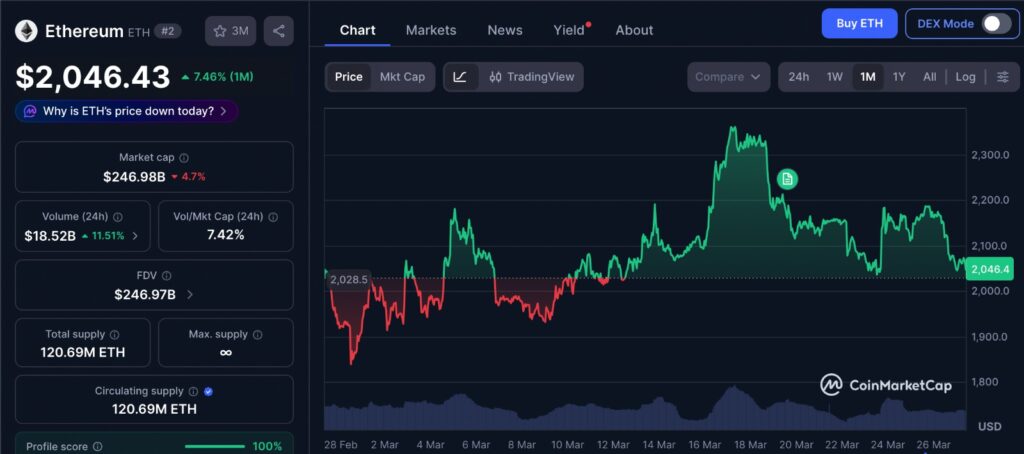
The one-month price chart of ETH reflects a market that has moved through a sharp upward impulse followed by a gradual loss of momentum, settling into a tighter range. What stands out is how each attempt to sustain higher levels has been met with controlled selling rather than aggressive rejection, suggesting distribution rather than panic. At the same time, downside moves have lacked follow-through, indicating that buyers are still absorbing pressure at lower levels. This balance between supply and demand reinforces the broader theme of compression, where price remains contained as participants wait for clearer confirmation before committing capital.
Ether Price Indicators and Current Market Structure
Ether Price Indicators show ETH holding within a defined range, with repeated rejection near $2,400 reinforcing it as a supply-heavy zone. Each test of this level has been met with enough selling to halt momentum, but not enough to reverse the broader structure lower.
This creates a specific type of market condition where liquidity builds on both sides. Sellers defend resistance, while buyers absorb dips at support. The result is compression, where price becomes increasingly sensitive to any shift in positioning.
What matters here is not just the range itself, but how long it persists. Extended consolidation tends to concentrate liquidity, which can amplify the eventual move once a clear imbalance emerges.
Derivatives Metrics as Ether Price Indicators
Funding Rates and Market Sentiment
One of the more precise Ether Price Indicators is funding rates, which reflect how traders are positioned in perpetual futures. These rates are essentially a balancing mechanism, where one side of the market pays the other depending on positioning.
Currently, funding remains close to neutral. This indicates that neither longs nor shorts are dominant enough to create stress in the system. In practical terms, it means there is no forced unwinding risk building beneath the surface.
This matters because strong moves often begin when the market is not crowded. When positioning is balanced, price can move with less resistance, as there are fewer overleveraged participants to unwind against the move.
Open Interest and Participation
Open interest tracks how much capital is actively deployed in derivatives markets. It is not just a measure of activity, but of commitment. Rising open interest alongside price suggests new positions are being built, rather than existing ones simply rotating.
At present, open interest has not expanded meaningfully. This suggests that traders are not adding exposure aggressively, even as price tests higher levels. Without this expansion, breakout attempts tend to lack continuation.
For ETH to move through $2,400, participation needs to increase in a controlled manner. Sudden spikes in open interest can indicate speculative buildup, but gradual increases tend to reflect stronger conviction.
Spot Demand and Ether Price Indicators
Institutional Flows
Spot demand remains one of the more decisive Ether Price Indicators because it represents actual capital deployment rather than leveraged positioning. Unlike derivatives, spot buying cannot be easily unwound without direct selling pressure.
Recent flows into ETH-related investment products have remained relatively muted. This suggests that larger allocators are not yet increasing exposure in size. Institutional behavior typically follows confirmation rather than anticipation, which explains the current lack of aggressive inflows.
When these flows increase, they tend to provide sustained support rather than short bursts of momentum. Until then, the market lacks a consistent source of demand capable of absorbing supply at higher levels.
Spot Volume and Market Activity
Spot volume reflects the intensity of participation in real transactions. It differs from derivatives activity in that it requires actual asset exchange rather than leveraged exposure.
Current volume levels indicate participation without urgency. Trades are occurring, but not at a scale that suggests directional conviction. This often results in price movements that stall near resistance, as there is insufficient demand to push through.
An increase in spot volume during upward moves would signal that buyers are willing to transact at higher prices, which is necessary for a sustained breakout.
Onchain Data as Ether Price Indicators
Onchain activity provides a direct view into how the network is being used. These Ether Price Indicators include transaction counts, user interaction, and general network engagement.
Current data shows stable but flat activity. The network is functioning consistently, but there is no notable expansion in usage. This aligns with the broader market behavior, where participation exists but is not accelerating.
In previous expansion phases, increased network activity has coincided with price appreciation. This relationship reflects underlying demand rather than speculative positioning. Without that expansion, price movements tend to rely more heavily on market structure than organic growth.
What Needs to Change for a Break Above $2,400
For Ether Price Indicators to align toward a move above $2,400, multiple layers of the market need to shift together.
Derivatives participation must increase, but without creating imbalances in funding rates. This would indicate that new positions are being built with discipline rather than excess leverage.
Spot demand needs to strengthen through higher volume or consistent inflows. This provides the base layer of support required to sustain higher prices once resistance is breached.
Onchain activity should show signs of expansion, reflecting increased network usage. This adds structural backing to price movements, reducing reliance on short-term positioning.
Without alignment across these areas, upward moves are likely to face resistance rather than continuation.
Ether Price Indicators Show a Neutral Market Phase
Ether Price Indicators currently reflect equilibrium. Buyers are not retreating, but they are also not competing aggressively for higher prices. Sellers are active at resistance, but not dominant enough to drive price lower.
This balance creates a controlled environment where volatility compresses and liquidity accumulates. While it may appear uneventful, this phase often determines how the next move unfolds.
The absence of extremes across key indicators suggests that the market is stable, but waiting for a catalyst that can shift participation.
Editor’s View: Why Participation Still Feels Delayed
What is notable is not just the lack of momentum, but the lack of urgency across participants. Even when price approaches resistance, there is no visible chase from buyers, which suggests that capital is waiting for confirmation rather than reacting to price alone. This kind of behavior often appears when market participants have recently been conditioned by failed breakouts, making them more selective with entries. The result is a market that looks stable on the surface but is actually shaped by hesitation, where decisions are delayed until structure and participation align more clearly.
Final Take on Ether Price Indicators
Ether Price Indicators point toward a market that is structurally intact but not yet activated. The lack of extreme signals across derivatives, spot demand, and onchain activity suggests that ETH is not being driven by imbalance.
Instead, the market is operating within a controlled range where participation remains measured. A move above $2,400 will depend on whether these indicators begin to reinforce each other rather than act independently. Until that alignment occurs, price behavior is likely to remain constrained within its current structure.
Disclaimer: This content is for informational purposes only and does not constitute financial advice.
Keep yourself updated with the latest crypto news with FYI Gazette
Read more about Memecoins with FYI Gazette
Keep yourself updated with the latest Altcoin News with FYI Gazette
 Bitcoin
  Ethereum
  Tether
  BNB
BNB  XRP
XRP  Solana
  Dogecoin
  Litecoin
  Pepe
Pepe