
Ethereum price drops toward $3K as ETF demand cools
Ethereum price has faced strong selling pressure over the past week as institutional demand through spot ETFs continues to decline. With capital inflows slowing and technical indicators flashing red, analysts warn that the second-largest cryptocurrency could soon retest the $3,000 mark, erasing gains from the previous quarter.
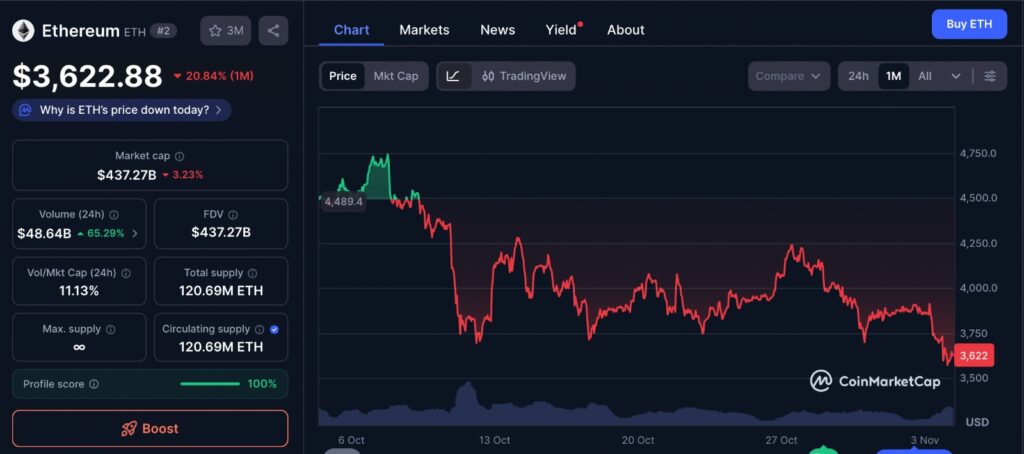
The chart above from CoinMarketCap illustrates Ethereum’s price movement over the past month, showing a gradual decline from early highs near $4,000 to current levels hovering around the mid-$3,000 range. The one-month trend highlights growing volatility, with multiple failed recovery attempts aligning with recent ETF outflows and market uncertainty. This visual snapshot underscores the shifting sentiment in Ethereum price dynamics as traders weigh weakening institutional demand against broader crypto market conditions.
Institutional outflows drag Ethereum price lower
Recent data shows that spot Ethereum exchange-traded funds (ETFs) in the United States have recorded consistent net outflows. Over three consecutive trading sessions, these ETFs saw around $363.8 million withdrawn, signaling cooling demand from institutional investors who were previously key supporters of ETH’s price momentum.
According to market analytics firm CoinShares, large funds and corporate treasuries that once accumulated ETH are now scaling back. Holdings across strategic reserves and ETF products have declined by more than 124,000 ETH since mid-October, indicating that major buyers are no longer adding to their positions.
Market strategist Ted Pillows commented that “treasury companies will soon run out of money to buy ETH,” implying that institutional buying power may have peaked. This sentiment has weighed heavily on confidence, with traders expecting further downside in the near term.
Technical signals point to bearish momentum in Ethereum price
From a technical analysis perspective, Ethereum price action has been forming a descending triangle pattern since early October. This pattern, defined by a flat support line and a descending resistance trendline, often serves as a bearish reversal indicator.
If ETH decisively breaks below the lower boundary of this triangle, chart projections suggest a potential move down to around $2,870, roughly 22 percent below current levels. Such a move would mark Ethereum’s weakest performance since early 2024.
Adding to the negative outlook, the SuperTrend indicator recently flipped from green to red on the eight-hour chart, signaling a transition from bullish to bearish conditions. Analysts view this as confirmation that market momentum has shifted against ETH in the short term.
Key support zones for Ethereum price
As of early November, Ethereum is trading near $3,720, down roughly 10 percent from the prior week. The key zone of interest for traders is the $3,700 region, which has served as a short-term floor. A sustained break below this level could open the path toward $3,500 and potentially $3,350 in the coming days.
Technical traders are watching three crucial price levels:
- $3,700: Immediate support that has held multiple times since October.
- $3,500: Next horizontal support, aligning with the lower range of the descending triangle.
- $2,870: The theoretical target if the triangle breakdown completes fully.
Failure to hold these levels could confirm a bearish continuation pattern and set the stage for a deeper correction below $3,000.
Why institutional demand for Ethereum price is fading
The cooling demand for ETH-based ETFs reflects broader uncertainty among professional investors. After initial excitement following the approval of US spot Ethereum ETFs earlier this year, trading volumes have steadily declined.
Analysts suggest several reasons for this pullback:
- Profit-taking after early gains: Many funds entered ETH positions around the $2,500–$2,800 levels and are now securing profits.
- Market rotation: Some institutional money has shifted toward Bitcoin ETFs, which continue to attract heavier inflows following improved macro sentiment.
- Lack of catalysts: Unlike earlier in 2024, when Ethereum network upgrades spurred optimism, recent months have seen fewer major on-chain developments.
The result is a noticeable slowdown in buying activity, reducing one of the main stabilizing forces that previously supported Ethereum price above $3,500.
Broader crypto sentiment weighs on Ethereum price
Ethereum’s decline is not happening in isolation. Broader crypto market sentiment has softened amid renewed risk aversion. Bitcoin has also lost momentum, slipping back below $70,000, which often amplifies downside pressure on altcoins.
The combination of weaker ETF flows, declining liquidity, and macroeconomic uncertainty, especially around potential interest rate changes, has contributed to cautious investor behavior. Traders are opting for shorter positions or hedging through futures, further reinforcing downward momentum.
Despite the weakness, some analysts maintain that this pullback may be temporary. They argue that the underlying fundamentals of the Ethereum network, such as its role in decentralized finance (DeFi), staking yield appeal, and growing Layer-2 ecosystem, remain intact. However, near-term volatility is expected to persist until institutional flows return.
Potential catalysts that could reverse Ethereum price weakness
While the short-term view is bearish, several developments could stabilize or even reverse Ethereum’s downtrend:
- Renewed ETF inflows: A turnaround in ETF demand would signal restored institutional confidence and potentially attract fresh capital.
- Network upgrades or staking reforms: Major technical updates could renew interest from both retail and professional investors.
- Macroeconomic relief: If broader market sentiment improves or interest rates stabilize, risk assets like ETH could benefit from renewed speculative inflows.
- Regulatory clarity: Positive policy signals from the US or other major markets could ease investor caution surrounding crypto funds.
If any of these catalysts emerge, Ethereum could regain momentum and reclaim the $4,000 level in later months.
Outlook: Can Ethereum price hold above $3,000?
For now, Ethereum price remains at a crossroads. The current confluence of technical and fundamental factors leans bearish, but the long-term narrative for ETH remains constructive. Institutional outflows suggest short-term fatigue, not necessarily structural rejection.
If bulls manage to defend the $3,500–$3,700 support range, a rebound toward $4,000 remains possible. However, if selling pressure intensifies and ETF outflows persist, a retest of $3,000 or even the projected $2,870 level becomes increasingly likely.
Investors are advised to watch both ETF flow data and technical support zones closely. A decisive recovery in ETF demand or a strong breakout above resistance could signal the end of the current correction phase. Until then, Ethereum price appears locked in a period of consolidation and heightened volatility.
Keep yourself updated with the latest crypto news with FYI Gazette
 Bitcoin
  Ethereum
  Tether
  XRP
XRP  BNB
BNB  Solana
  Dogecoin
  Litecoin
  Pepe
Pepe