
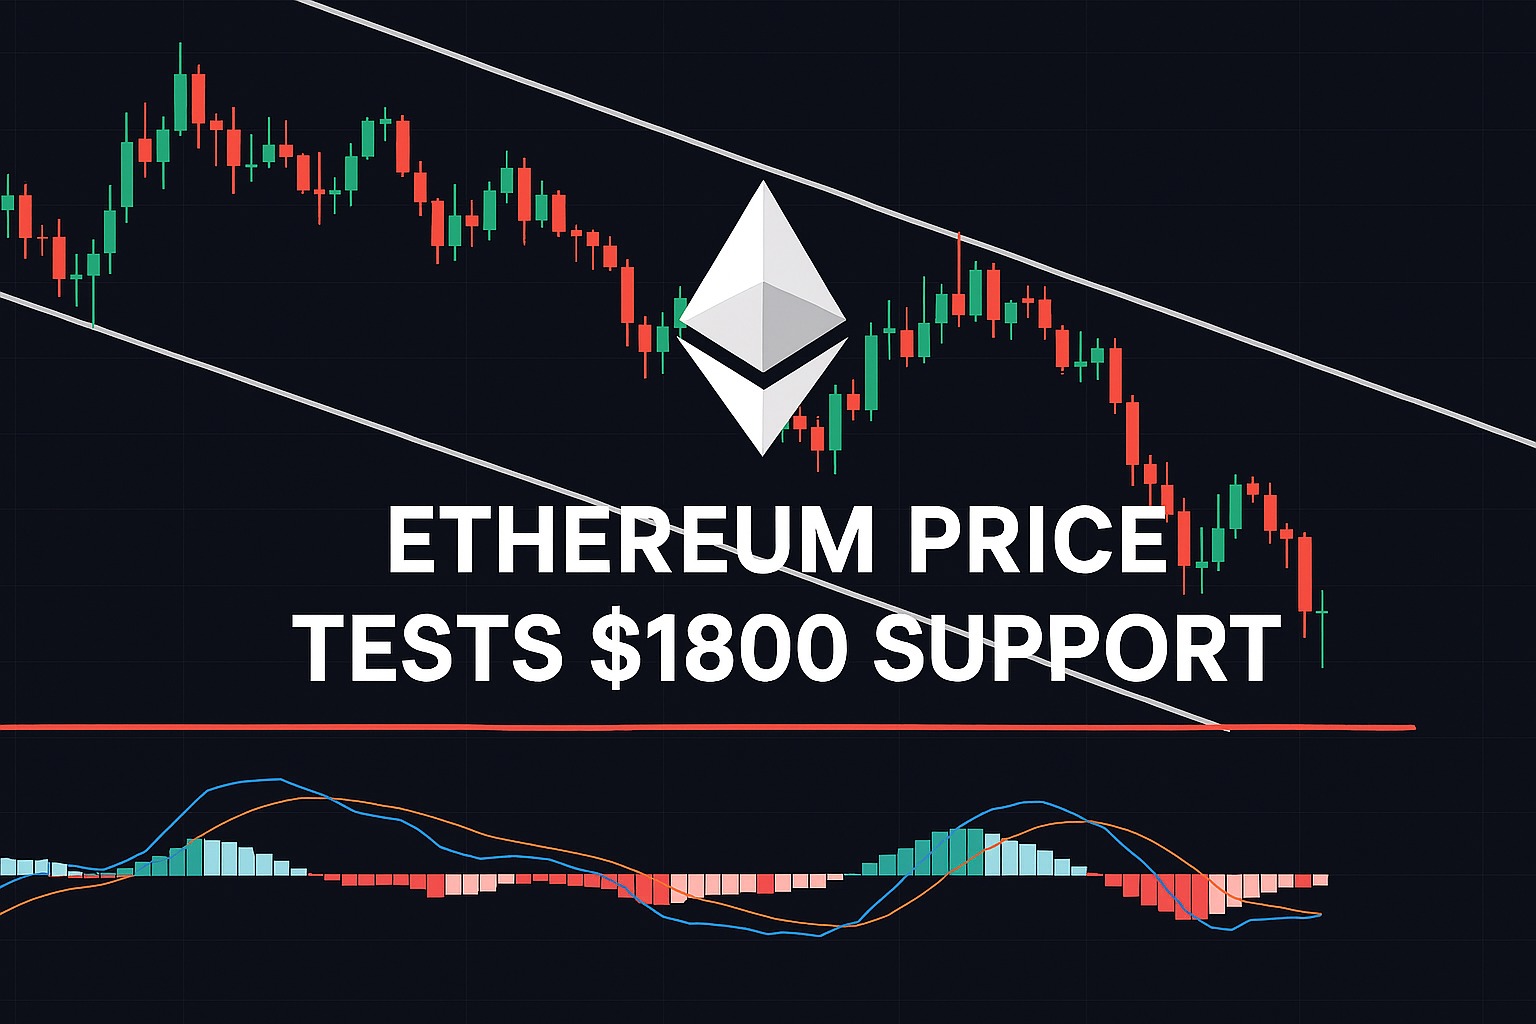
Ethereum Price Pressure Tests 1800 Support
Ethereum Price Pressure has strengthened as large holder activity introduces fresh supply into an already cautious market environment. Recent on chain movements involving a major whale have increased attention around Ethereum’s short term stability, particularly as price hovers near an important technical threshold. The speed and structure of the transaction highlight how concentrated flows continue shaping market sentiment.
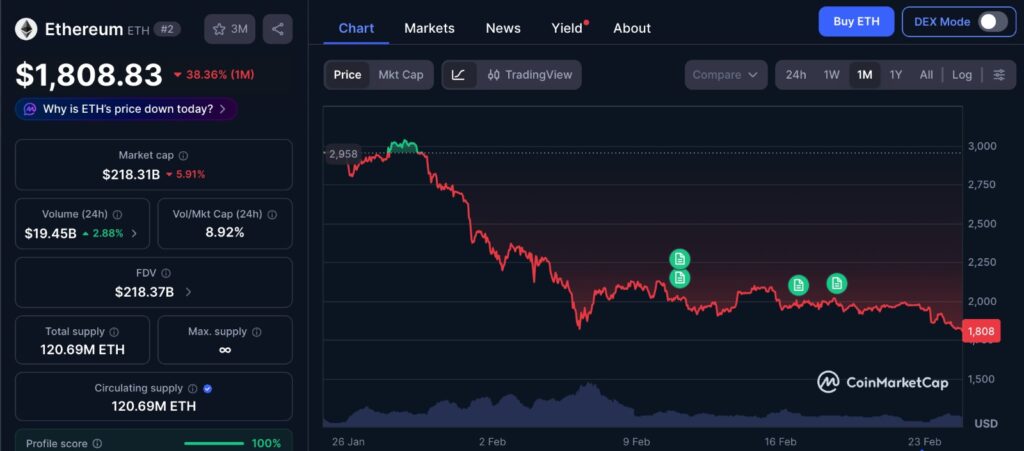
Over the past month, Ethereum’s price behavior has reflected a market caught between stabilization attempts and persistent structural pressure. Rather than displaying a decisive directional trend, the chart illustrates repeated reactions around key levels, where brief recoveries have struggled to establish sustained momentum. This type of movement often indicates cautious positioning, as participants balance short term opportunity with broader uncertainty. The compression visible across the period underscores how liquidity and sentiment continue to interact near critical zones, shaping volatility without yet delivering clear resolution.
Whale Distribution Adds Supply Shock
Ethereum recently witnessed a notable distribution event when whale address 0xeadc offloaded 16924 ETH valued at roughly 31.97 million dollars within a thirty minute window. The scale of the transaction immediately stood out, not only because of its size but also because of how it was executed. Instead of gradual selling through exchange order books, the assets were converted rapidly into stablecoins.
Such swift conversion often signals deliberate positioning rather than passive portfolio management. The decision to execute through CoW Protocol settlements further indicates structured unloading. This method allows large participants to manage execution efficiency while still injecting meaningful supply into the market.
When tens of millions of dollars worth of ETH enter circulation within a compressed period, liquidity dynamics become sensitive. Markets must quickly adjust to absorb the additional supply. If demand remains muted, price reactions can become more volatile as balance shifts toward sellers.
Price Structure Remains Under Pressure
Ethereum continues trading within a long term descending channel that has governed price behavior since the 4800 peak. This formation reflects a persistent pattern of lower highs, reinforcing the broader narrative of structural weakness. Recovery attempts have repeatedly failed to reclaim declining resistance levels.
Previous breakdowns below key zones, including 2797 and later 2261, confirmed continuation of bearish conditions. These levels once served as meaningful support but now represent lost ground within the larger trend. The repeated inability to sustain upward momentum underscores ongoing market caution.
At present, Ethereum trades near 1828 dollars, placing the asset directly against the widely observed 1800 support area. This region has emerged as a critical technical level. It represents the last major horizontal defense before price potentially explores deeper support zones.
Importance of the 1800 Support Level
The 1800 level carries significance beyond a simple round number. Technically, it marks a major structural boundary within the descending channel. A decisive break beneath this zone could open the door to broader downside extension, with the next notable support positioned closer to 1400.
Support levels function as areas where buyers historically demonstrate interest. However, their effectiveness depends on active participation. Without sufficient demand, even well defined supports can weaken under persistent selling pressure.
Conversely, sustained defense at 1800 could encourage short term stabilization. Buyers stepping in aggressively may trigger relief driven rotation toward higher resistance zones. The durability of any rebound would depend on renewed conviction rather than isolated reactions.
Momentum Signals Suggest Moderation
Short term momentum indicators provide a mixed yet informative picture. The MACD has crossed above its signal line, while histogram readings print positive values. This shift suggests that immediate downside momentum has eased compared to previous sessions.
Despite this crossover, both MACD related lines remain below the neutral threshold. This positioning implies that broader trend conditions remain negative. In practical terms, selling pressure may have slowed, but structural reversal remains unconfirmed.
Temporary relief phases frequently occur within extended downtrends. Without price reclaiming broken resistance levels, momentum improvements alone rarely indicate lasting shifts. Traders often interpret such signals as stabilization attempts rather than directional change.
Spot Demand Shows Neutral Behavior
Order flow dynamics further highlight market hesitation. Ethereum’s Spot Taker CVD has transitioned toward neutral balance after previously reflecting buy side dominance. Neutral readings indicate that aggressive buyers and sellers currently operate in relative equilibrium.
Balanced order flow is not inherently bearish, but it reduces confidence in immediate recovery strength. During periods of elevated distribution, stronger buyer initiative becomes necessary to absorb supply effectively. Without clear taker side expansion, upward momentum may struggle.
A renewed shift toward positive CVD dominance would suggest improving demand conditions. Until such changes emerge, consolidation near structural support remains the more conservative interpretation.
Overhead Liquidity and Liquidation Zones
Leverage positioning introduces another variable into Ethereum’s outlook. Liquidation heatmaps reveal a dense liquidity cluster near the 1923 region. These zones often attract price movements during volatility expansions as markets seek available liquidity.
Recent liquidation data shows that long positions have already experienced substantial flushes. This suggests that overhead liquidity may represent trapped leverage rather than immediate resistance. If buyers regain short term control, price could rotate upward to clear these concentrations.
Market at a Decisive Inflection Point
Ethereum now sits at an important inflection point where whale distribution, neutral demand, and persistent structural pressure converge. The interaction between supply absorption and buyer participation will likely determine short term direction.
Failure to sustain the 1800 support may expose Ethereum to deeper structural testing. Successful defense could enable temporary stabilization. Market behavior in upcoming sessions will provide clearer signals regarding underlying strength.
Editor’s View: Market Behavior Beneath the Surface
What stands out in conditions like these is not just price compression but participant psychology. Large distribution events often alter trader behavior more than indicators immediately reveal, as short term participants grow reactive rather than conviction driven. Support zones under such circumstances become sentiment tests rather than purely technical levels, reflecting hesitation, risk management, and positioning adjustments across the market. The absence of aggressive dip buying frequently signals caution rather than weakness, particularly when traders remain sensitive to further volatility. This behavioral shift tends to shape how liquidity responds long before structural resolution becomes visible on charts.
Final Summary
Whale driven distribution near 1800 heightens Ethereum’s sensitivity to demand fluctuations. Strong buyer defense would signal resilience despite elevated supply. A breakdown beneath this zone would shift focus toward the next major support near 1400.
Disclaimer: This content is for informational purposes only and does not constitute financial advice.
Keep yourself updated with the latest crypto news with FYI Gazette
Read more about Memecoins with FYI Gazette
Keep yourself updated with the latest Altcoin News with FYI Gazette
 Bitcoin
  Ethereum
  Tether
  XRP
XRP  BNB
BNB  Solana
  Dogecoin
  Litecoin
  Pepe
Pepe