
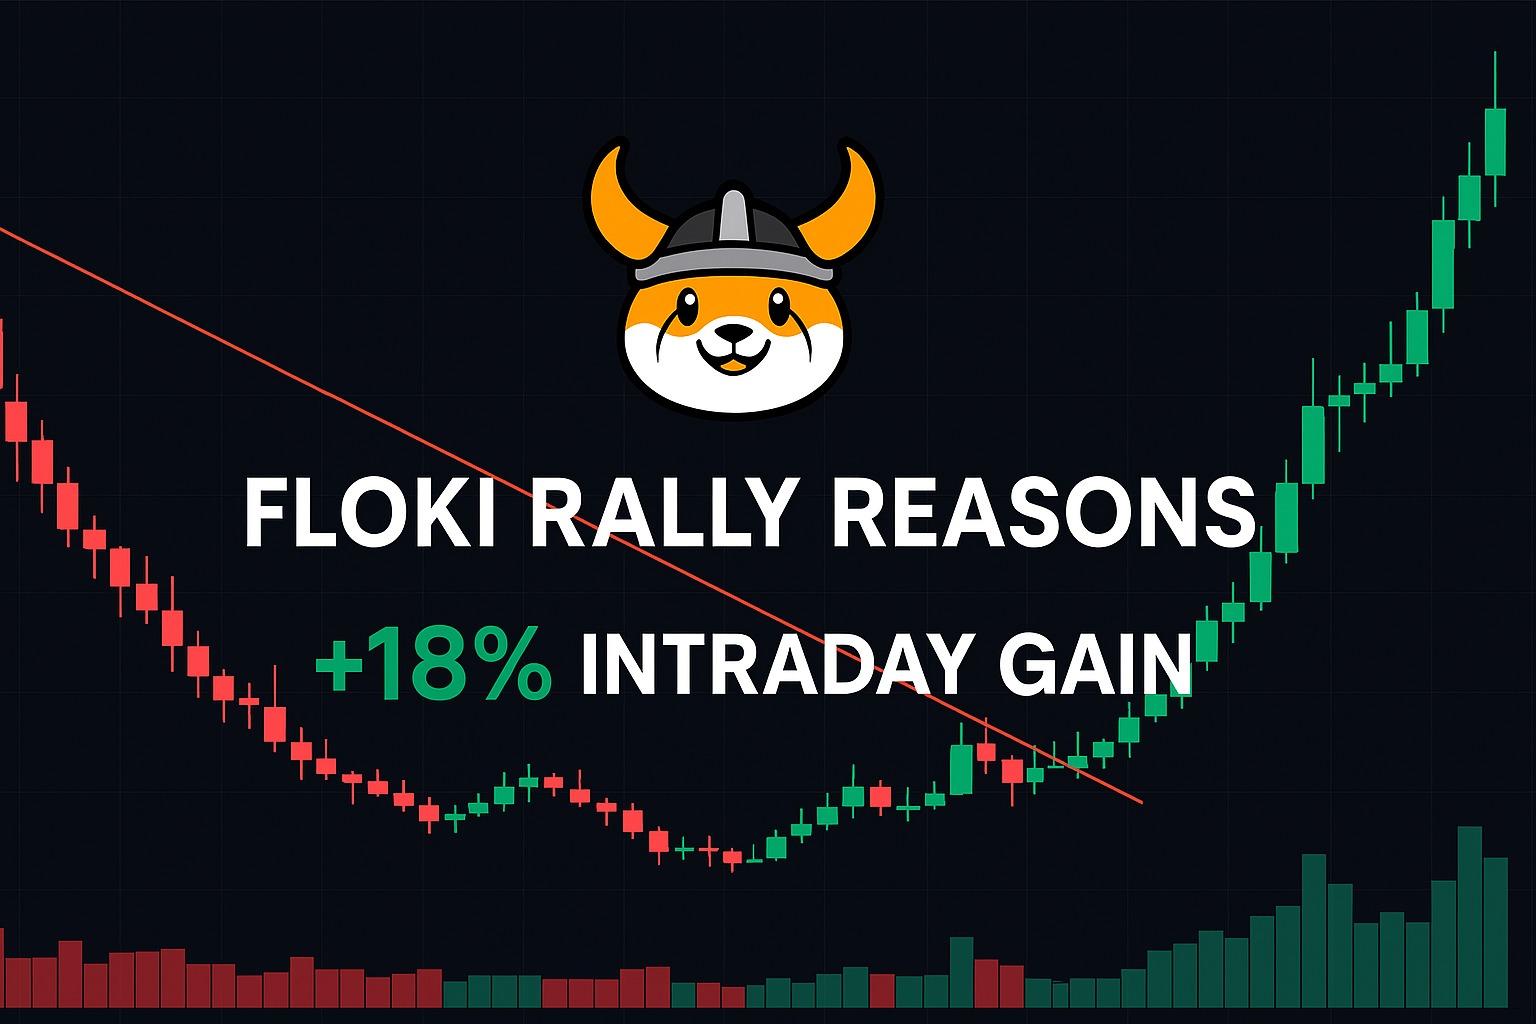
Floki rally reasons behind the recent rebound
Floki rally reasons are gaining attention as the memecoin stages a noticeable rebound despite suffering a steep 72 percent decline over the past year. While long term performance remains weak, recent price action has shifted sentiment, encouraging traders to examine the technical signals behind this move. The rally has raised questions about whether this is a short term bounce or the beginning of a broader recovery.
In early January, FLOKI recorded an intraday gain of nearly 18 percent, marking one of its strongest daily performances in months. This move stood out because it followed a prolonged period of selling pressure that had dominated the token’s chart through late 2025. Even as the broader crypto market remained uncertain, FLOKI managed to attract renewed buying interest, setting the stage for closer technical analysis.
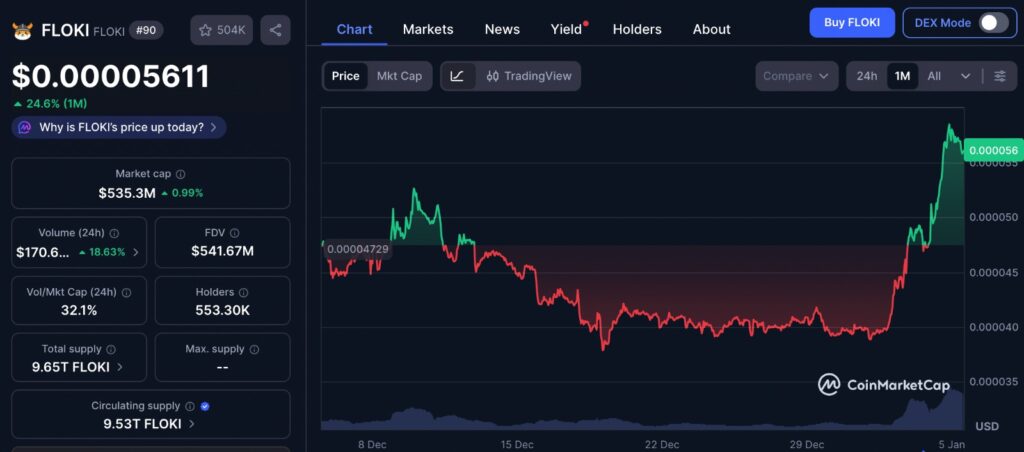
The one-month price chart highlights how FLOKI has recently shifted away from a prolonged period of sideways and downward movement. For most of the month, price action remained compressed, reflecting limited buying interest and persistent selling pressure. However, the latest breakout is clearly visible on the chart, showing a sharp upward move supported by increased activity. This visual trend aligns with the broader technical signals discussed above, reinforcing the idea that short-term momentum has improved, even as the token continues to recover from deeper yearly losses. While the chart confirms renewed interest, it also shows that volatility remains elevated, suggesting that price direction will continue to depend heavily on sustained buying strength.
Floki rally reasons linked to a key technical breakout
One of the main Floki rally reasons lies in a confirmed breakout from a descending resistance trendline. For several months, this resistance acted as a barrier, rejecting every upward attempt and keeping price action suppressed. Each rally attempt was met with strong selling, reinforcing the bearish structure.
The latest breakout, however, marked a shift in market behavior. After multiple failed attempts, buyers finally pushed FLOKI above this trendline, suggesting that sellers were losing control. Technical traders often view such breakouts as early signs of trend reversal, especially when they occur after extended consolidation or decline.
This breakout was not isolated. It occurred alongside a clear increase in trading volume, signaling stronger participation from market players. Rising volume during a breakout is often interpreted as confirmation that buyers are entering with conviction rather than reacting emotionally to price fluctuations.
Volume growth strengthens Floki rally reasons
Another important factor supporting Floki rally reasons is the spike in trading volume. During the rally, daily volume climbed significantly, indicating increased interest and liquidity. Volume expansion is critical because breakouts without volume often fail quickly.
Higher volume suggests that more traders are willing to commit capital at current price levels. This behavior reduces the likelihood of an immediate pullback and improves the odds of price continuation, at least in the short term. However, sustained volume will be required if the rally is to evolve into a longer trend.
Technical indicators supporting Floki rally reasons
Parabolic SAR shows bullish momentum
The Parabolic Stop and Reverse indicator provided one of the clearest Floki rally reasons from a technical standpoint. When its dots appear below price action, it typically signals bullish momentum and trend continuation.
During FLOKI’s recent surge, the Parabolic SAR flipped beneath the price for the first time in weeks. This change suggested that momentum had shifted in favor of buyers. Traders often use this indicator to identify trend direction and trailing stop levels, making it particularly relevant during breakout phases.
While the signal is positive, it should be monitored closely. If price weakens and SAR dots move above the chart again, it could indicate fading momentum.
Money Flow Index confirms buying pressure
Another indicator supporting Floki rally reasons is the Money Flow Index. This tool measures buying and selling pressure by combining price and volume data. When the MFI moves above the 50 level, it typically reflects stronger inflows than outflows.
FLOKI’s MFI recently crossed above this midpoint, indicating increased buying interest. This suggests that capital is flowing into the asset rather than exiting it. While not a guarantee of sustained upside, this shift aligns with the broader narrative of renewed demand.
That said, rapid MFI increases can sometimes signal short term overheating, meaning traders should remain cautious if the indicator climbs too quickly.
Accumulation and distribution signals mixed sentiment
Despite the bullish indicators, not all data supports an aggressive upside outlook. The Accumulation and Distribution indicator presents a more cautious view of Floki rally reasons.
Although short term accumulation was visible during the rally, the indicator remains in negative territory on a broader timeframe. This suggests that long term sellers are still present and that distribution has historically outweighed accumulation.
This imbalance highlights a key risk. Without sustained buying over time, the rally may struggle to overcome existing overhead supply.
Market sentiment and Floki rally reasons
Market psychology plays a major role in Floki rally reasons. After prolonged declines, traders often look for technical signals that suggest exhaustion among sellers. FLOKI’s breakout and indicator shifts provided such signals, attracting momentum traders and short term speculators.
However, overall sentiment remains cautious. Many participants are waiting for confirmation through higher highs, higher lows, and continued volume expansion. Without these confirmations, the rally could still be viewed as a relief bounce rather than a full trend reversal.
Editor’s View: Why sentiment matters beyond the chart
Beyond indicators and breakout levels, part of what is driving interest in FLOKI is how traders respond after extended drawdowns. Assets that have declined sharply over long periods often reach a point where selling pressure becomes less aggressive, not because confidence returns, but because most willing sellers have already exited. When even modest buying appears in this environment, price reactions can seem disproportionate to the actual inflow. This dynamic does not guarantee continuation, but it helps explain why short-term rallies can emerge even when long-term sentiment remains cautious.
What Floki rally reasons suggest going forward
Looking ahead, Floki rally reasons point to a technically improved structure but not a confirmed long term recovery. If buying pressure continues and key resistance levels are reclaimed, the token could attempt a move toward previous highs seen in late 2025.
On the downside, failure to hold above the breakout level could result in a pullback toward earlier support zones. This would test whether recent buyers are willing to defend their positions or if sellers will regain control.
In conclusion, Floki rally reasons are driven by a combination of technical breakout, rising volume, and improving momentum indicators. While these signals are encouraging, lingering selling pressure and mixed accumulation data suggest that caution remains necessary. The coming sessions will be crucial in determining whether this rebound develops into a sustained trend or fades into another temporary recovery.
Disclaimer: This content is for informational purposes only and does not constitute financial advice.
Keep yourself updated with the latest crypto news with FYI Gazette
Read more about Memecoins with FYI Gazette
Keep yourself updated with the latest Altcoin News with FYI Gazette
 Bitcoin
  Ethereum
  Tether
  XRP
XRP  BNB
BNB  Solana
  Dogecoin
  Litecoin
  Pepe
Pepe