
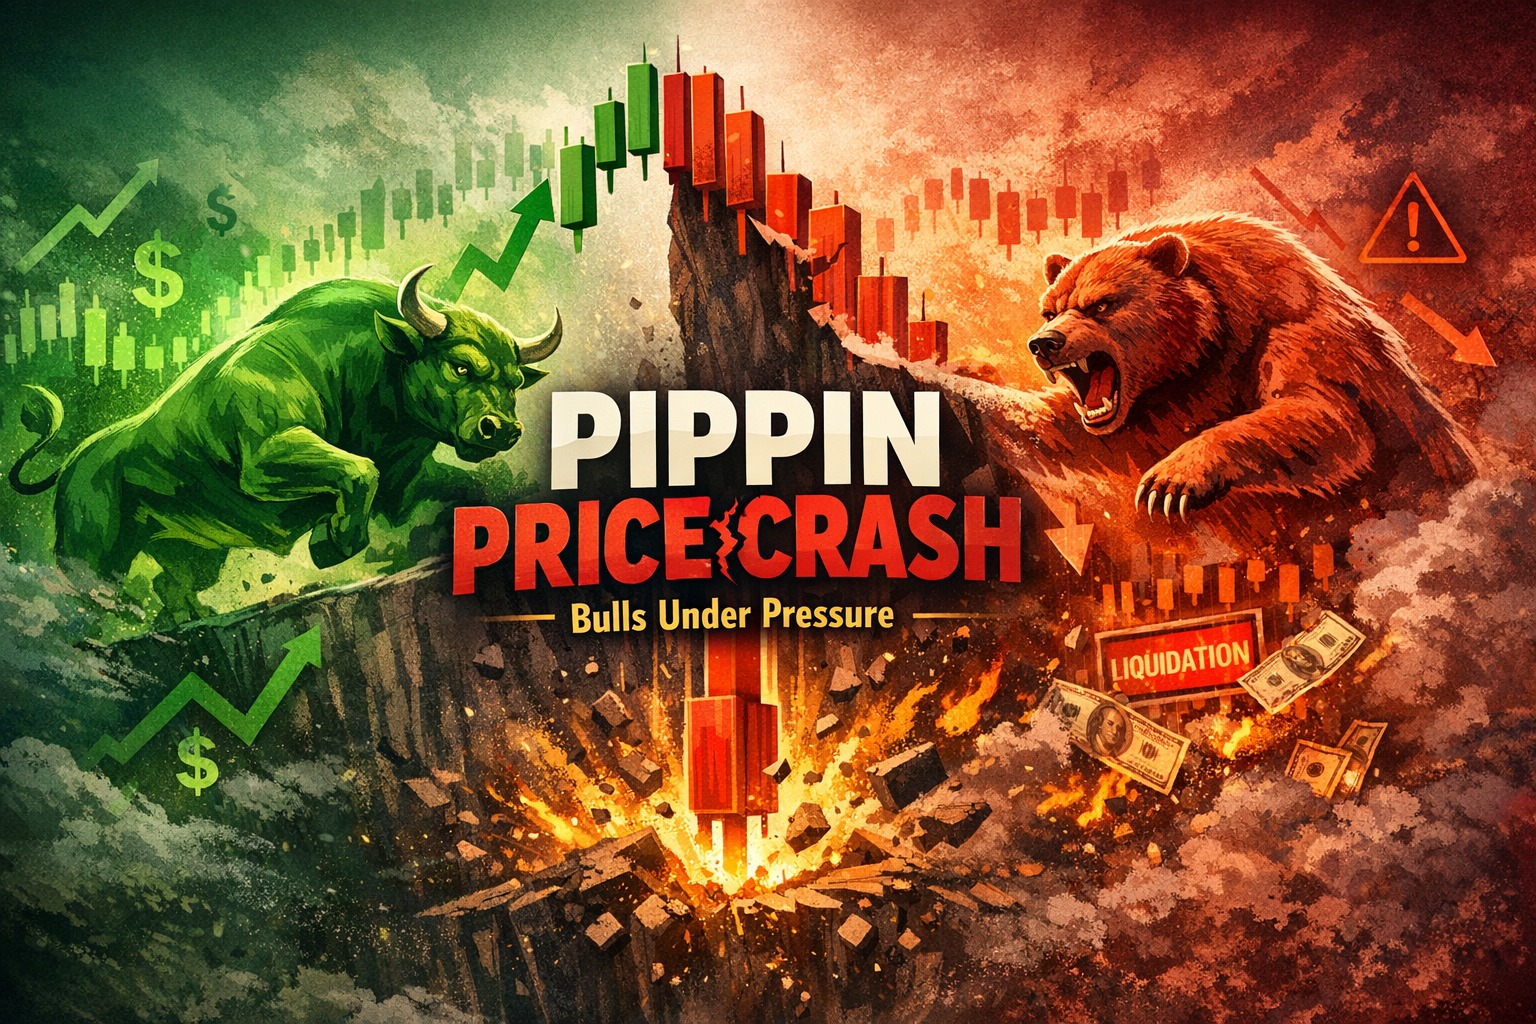
Pippin Price Crash puts bulls under pressure
Pippin Price Crash tends to reveal less about the level where price failed and more about who was participating at that stage of the move. As the rally approached 0.90, the composition of buyers likely shifted from early conviction to late positioning, where entries are driven by visibility rather than value. This transition creates a market that appears strong on the surface but lacks depth underneath, making it sensitive to even small changes in demand. When that marginal buying disappears, the adjustment is often sharp because there is little structural support left at elevated levels.
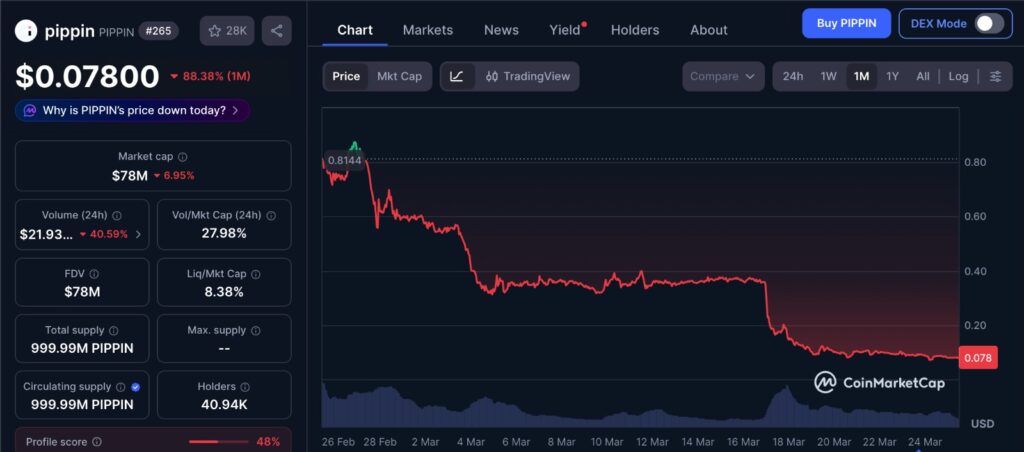
The chart reflects how sharply the Pippin price crash has compressed the token’s structure over the past month, with a clear transition from a high-volatility uptrend into a lower, more stable range. What stands out is not just the decline itself, but how price has begun clustering within a tighter band, suggesting that forced selling has largely been absorbed. This kind of behavior often indicates that the market has shifted from momentum-driven activity to a phase where participants are reassessing value rather than reacting to price movement.
Pippin Price Crash wipes out gains after 0.90 rejection
Pippin’s push toward 0.90 created the appearance of continuation, but the inability to hold above that level revealed a lack of committed buyers. In fast-moving markets, sharp rallies often rely on momentum traders entering after the move has already begun. When price reaches a visible resistance zone, early participants tend to distribute into that strength.
The rejection at 0.90 acted as that distribution point. Instead of absorbing selling pressure, the market rotated lower, erasing gains quickly. The speed of the decline suggests that much of the prior move was built on fragile positioning rather than sustained accumulation.
Liquidations fuel the Pippin Price Crash
The decline was amplified by long liquidations, which occur when leveraged positions are forced to close as price moves against them. As Pippin dropped, these positions were automatically exited, creating additional sell orders in the market.
At the same time, open interest fell by around 40 percent, indicating that traders were not replacing those positions. This matters because falling open interest during a decline reflects position unwinding rather than aggressive new shorting. In other words, the market was shedding risk rather than building a new directional bet.
This dynamic often leads to sharper moves, as forced selling accelerates price action beyond what organic selling alone would produce.
Pippin Price Crash breaks key support levels
Once the price moved below 0.15, the decline accelerated. Support levels function as areas where buying interest has previously absorbed selling pressure. When these levels fail, that demand is no longer present, and price tends to move quickly to the next area of interest.
The break below 0.15 signaled that the earlier structure had lost its integrity. Traders who entered during the rally now faced positions in loss, which can further increase selling pressure as they exit.
This shift also changes how the market views the asset. What was previously a rising structure becomes a broken one, where recovery requires rebuilding rather than continuation.
Momentum weakens after the Pippin Price Crash
Momentum indicators moved from strong bullish readings into a weaker state as the rally reversed. The relative strength index shifted into bearish territory but did not reach deeply oversold levels, suggesting that selling pressure increased without reaching exhaustion.
This distinction is important. When momentum cools without hitting extremes, it often reflects a market transitioning into consolidation rather than immediately reversing direction. Buyers are less aggressive, and sellers are no longer forced, leading to slower, more uncertain price action.
Without renewed demand, momentum alone is unlikely to drive price back toward previous highs.
Stabilization range after the Pippin Price Crash
After the sharp decline, Pippin began stabilizing between approximately 0.082 and 0.10. This range represents an area where selling pressure slowed and the market began to find temporary balance.
Such ranges often form after liquidation-driven moves, as the removal of leveraged positions reduces volatility. Participants who remain are typically less reactive, allowing price to stabilize.
However, stability does not imply strength. The market is pausing rather than reversing, and the range itself becomes a reference point for future movement.
Can bulls regain control after the Pippin Price Crash?
For bulls to regain control, price needs to move back above nearby resistance levels, particularly around 0.113. Reclaiming this level would indicate that buyers are willing to step in at higher prices rather than waiting for deeper pullbacks.
However, reclaiming resistance after a breakdown is structurally different from continuing an uptrend. It requires rebuilding confidence among participants who have recently experienced losses.
If buying interest remains cautious, upward moves may stall as sellers re-enter at previously broken levels. The market needs consistent demand, not isolated bursts of buying, to shift back into a stronger structure.
Short-term outlook following the Pippin Price Crash
In the short term, Pippin is likely to remain range-bound as the market processes the recent volatility. The transition from a liquidation-driven decline to a more stable environment typically involves reduced participation and slower price movement.
Traders will watch whether the current range holds, as this defines the immediate structure. A break below it would indicate that selling pressure has not fully dissipated, while holding it suggests that the market is stabilizing after the reset.
Until a clear directional move emerges, price action may continue to reflect indecision rather than trend.
Editor’s View: How late participation reshapes price behavior
The Pippin Price Crash reflects a familiar pattern where late entrants often define the top of a move without realizing it. As price accelerates, participation shifts from early conviction to reactive positioning, where traders are responding to momentum rather than underlying structure. This creates a fragile environment where support depends on continuous inflows, not committed buyers. Once that flow slows, price doesn’t just retrace, it adjusts quickly to levels where stronger hands are willing to engage again.
Broader implications of the Pippin Price Crash
The Pippin price crash highlights how leverage and positioning can shape short-term price behavior more than underlying demand. When rallies are driven primarily by speculative positioning, they tend to reverse once that positioning becomes crowded.
For market participants, this reinforces the need to distinguish between accumulation and momentum-driven moves. The former builds structure over time, while the latter depends on continuous inflows that may not persist.
As the market stabilizes, the focus shifts from how fast price moved to how it behaves within the current range. That behavior will determine whether the recent move was a temporary reset or part of a broader structural shift.
Disclaimer: This content is for informational purposes only and does not constitute financial advice.
Keep yourself updated with the latest crypto news with FYI Gazette
Read more about Memecoins with FYI Gazette
Keep yourself updated with the latest Altcoin News with FYI Gazette
 Bitcoin
  Ethereum
  Tether
  BNB
BNB  XRP
XRP  Solana
  Dogecoin
  Litecoin
  Pepe
Pepe