
Solana metrics turn bullish despite falling volume
Solana metrics are showing renewed strength across the network, with key indicators pointing toward growing user activity and accumulation. However, at the same time, a steady decline in trading volume has raised concerns about whether this bullish momentum can be sustained. This mixed set of signals has created uncertainty for traders and investors watching Solana closely.
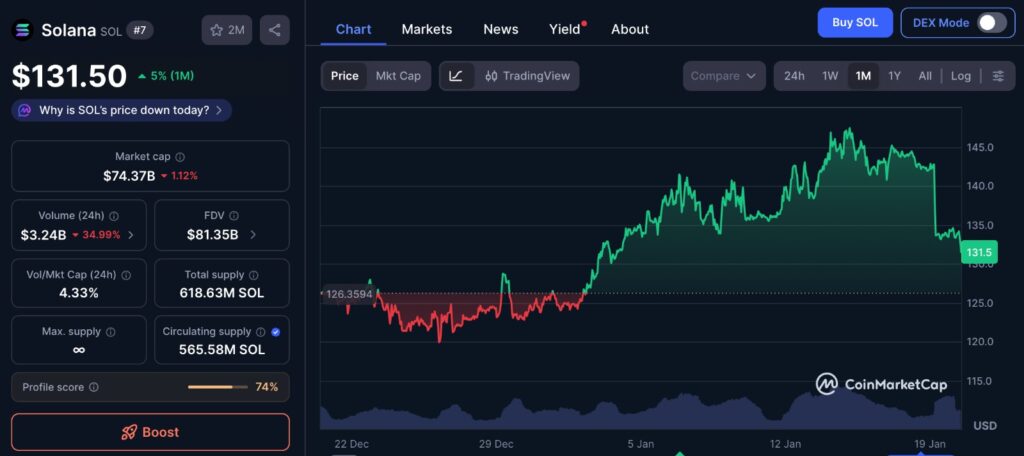
Viewed alongside the one-month price chart, Solana’s recent movement reflects a market that is compressing rather than trending. The price has respected clear boundaries, reacting consistently to similar levels instead of accelerating in one direction. This kind of structure often points to active participation from both sides of the market, but with neither gaining control. What stands out is not the magnitude of moves, but their restraint, suggesting that participants are responding more to risk awareness than to momentum. The chart captures a phase where positioning appears cautious and reactive, not speculative.
Solana metrics highlight rising network usage
Recent Solana metrics indicate a sharp increase in on-chain activity. The number of active addresses on the network rose significantly within a short time, suggesting that more users are interacting with the blockchain. This rise in participation reflects stronger engagement across decentralized applications, transfers, and other on-chain actions.
Weekly transaction counts also climbed to high levels, reinforcing the idea that network demand is improving. Higher transaction activity usually suggests that a blockchain is being actively used rather than sitting idle, which is often viewed as a positive sign for long-term value.
At the same time, Solana’s price reacted positively to a local demand zone. After pulling back, the price found support and began stabilizing. This price behavior aligned with technical indicators that showed Solana moving above a longer-term trend channel, signaling improving market structure.
Solana metrics from derivatives show buyer dominance
Beyond on-chain usage, Solana metrics from derivatives markets also leaned bullish. Data from cumulative volume delta showed that buyers were more aggressive than sellers in both spot and futures markets. This indicates that market participants were willing to buy at market prices rather than wait for lower levels.
Taker buy dominance is often associated with growing confidence, especially when it appears alongside rising network activity. When buyers consistently step in, it can reduce downside pressure and help prices stabilize or trend upward.
This behavior suggests that some traders believe Solana’s recent pullback may have been a temporary correction rather than the start of a larger decline.
Cooling spot volume raises concerns
Despite the positive signals, Solana metrics related to spot trading volume tell a different story. Spot volume across major exchanges has been declining steadily for several weeks. Lower volume means fewer participants are actively trading, which can weaken price momentum.
In some cases, falling volume during consolidation can be healthy. It may indicate that sellers are exhausted and that the market is preparing for another move higher. This often happens after a strong rally when traders pause before continuing.
However, extended periods of declining volume can also signal reduced interest. In past market cycles, similar patterns were seen before longer bearish phases began. This historical comparison has caused some analysts to remain cautious despite the bullish on-chain data.
Solana metrics show accumulation behavior
Other Solana metrics suggest that long-term holders are not rushing to sell. Holder net position change data has remained positive, indicating that investors are accumulating SOL rather than distributing it. This behavior is usually interpreted as confidence in future performance.
Exchange balance data supports this view as well. More SOL tokens have been leaving exchanges than entering them, which suggests that holders are moving assets into private wallets. This often reduces immediate selling pressure, as tokens held off exchanges are less likely to be sold quickly.
While accumulation is generally a bullish sign, it does not guarantee immediate price increases. Markets still require sufficient demand and volume to push prices higher.
Solana metrics and market resistance levels
Even with improving fundamentals, Solana has struggled to reclaim key resistance levels. Price attempts to move above important psychological zones have been met with selling pressure. This has kept SOL in a range rather than allowing a clear breakout.
This resistance could reflect uncertainty among traders who are waiting for confirmation before committing more capital. It may also be influenced by broader market conditions, as major assets often impact altcoin behavior.
Solana metrics alone cannot override wider market sentiment. If overall crypto liquidity remains weak, even strong individual projects can experience slow price action.
How traders and investors may interpret Solana metrics
For long-term investors, the current Solana metrics may suggest patience. Rising network activity and accumulation behavior point toward underlying strength, which could support value over time. Gradual accumulation strategies may help reduce risk during uncertain periods.
Short-term traders may take a more cautious approach. Falling spot volume can lead to unpredictable price swings and false breakouts. Monitoring volume alongside price action may help avoid entering trades with low conviction.
It is important to consider multiple indicators rather than relying on a single metric. Bullish signals lose strength if they are not supported by participation and liquidity.
Editor’s View: Solana metrics and trader behavior
One element charts do not fully capture is how traders behave during periods of uncertainty rather than momentum. When volume fades while on-chain activity improves, it often reflects hesitation, not lack of interest. Many participants appear to be watching closely instead of acting, waiting for confirmation before committing capital. This kind of environment tends to favor patience over conviction, as both buyers and sellers are reluctant to push price aggressively. In such phases, the absence of volume can say more about mindset than about fundamentals.
Final thoughts on Solana metrics
Overall, Solana metrics present a mixed but informative picture. Network usage is rising, buyer pressure is visible, and long-term holders appear confident. These factors suggest resilience within the ecosystem.
However, cooling trading volume remains a key concern. Without renewed participation, price movement may stay limited or become more volatile. Whether Solana can convert strong fundamentals into sustained upward momentum will depend on how volume and broader market conditions evolve.
For now, Solana metrics point to cautious optimism rather than clear confirmation of a strong uptrend.
Disclaimer: This content is for informational purposes only and does not constitute financial advice.
Keep yourself updated with the latest crypto news with FYI Gazette
Read more about Memecoins with FYI Gazette
Keep yourself updated with the latest Altcoin News with FYI Gazette
 Bitcoin
  Ethereum
  Tether
  BNB
BNB  XRP
XRP  Solana
  TRON
TRON  Dogecoin
  Litecoin
  Pepe
Pepe