
Monero Reversal Zones Highlight Key XMR Support Levels
Monero Reversal Zones are now under close observation as XMR undergoes a sharp correction after its recent rally. The cryptocurrency has dropped more than 40 percent from its latest peak, forcing traders to reassess where the price could stabilize or reverse. This pullback has brought XMR into important technical areas that may define its next major move, whether that is a recovery bounce or a deeper continuation lower.
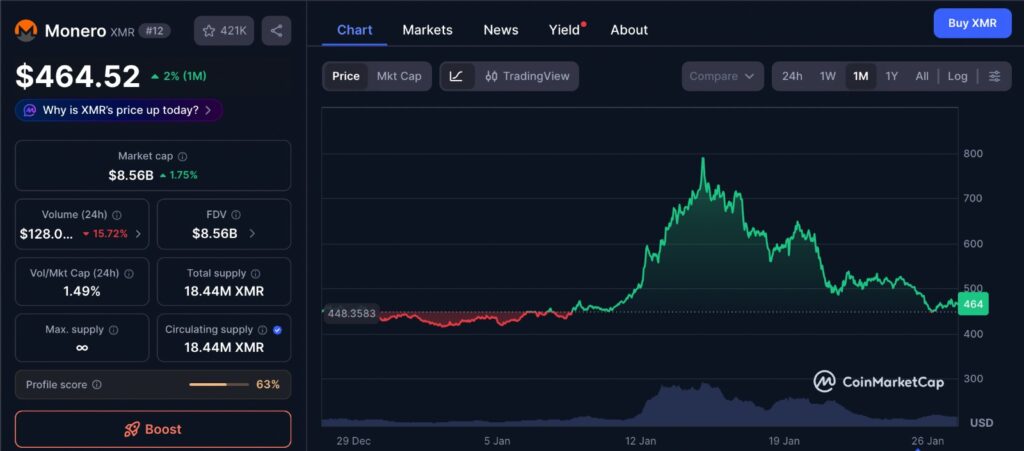
Monero experienced a strong bullish run earlier, pushing price to a new all-time high near the 800 level. That rally was driven by strong momentum and rising volume, but the move became overheated. Once sellers stepped in, the correction unfolded quickly, wiping out a large portion of the gains. The speed and depth of the decline have shifted market focus toward identifying reliable Monero reversal zones.
Viewed over the past month, Monero’s price action shows a transition from momentum-driven expansion to controlled retracement rather than abrupt reversal. The chart reflects a clear loss of upside acceleration, but it also lacks the sharp volatility spikes that typically accompany forced selling. This kind of structure often points to profit-taking and rebalancing instead of broad capitulation. As a result, recent candles provide more information about market participation and pacing than about directional conviction.
Why Monero Reversal Zones Matter Right Now
Large retracements after strong rallies are common in crypto markets. In Monero’s case, the drop of roughly 43 percent aligns closely with previously projected pullback targets. These projections highlighted two main downside areas where buyers were expected to show interest. Price has now reached those zones, making them critical decision points.
Reversal zones are not guaranteed turning points, but they help traders assess risk. If buyers defend these areas, it can signal accumulation and trend continuation. If they fail, it often leads to further downside and increased bearish pressure. That is why current price behavior near support is especially important.
Current Market Structure and Trend Context
On higher timeframes, Monero still maintains a broader bullish structure despite the recent sell-off. The overall trend has not completely broken, but short-term momentum has weakened. This creates a mixed environment where both recovery and further decline remain possible.
Technical indicators reflect this uncertainty. Momentum indicators have moved below neutral levels, showing reduced buying strength. Price is also trading below key short-term moving averages, which now act as resistance rather than support. These signals suggest caution, especially for traders expecting a quick rebound.
At the same time, the broader crypto market has not been particularly supportive. Bitcoin’s struggle to reclaim higher levels has limited confidence across altcoins. Until overall market sentiment improves, Monero’s upside may remain capped.
Key Monero Reversal Zones on the Downside
The most important Monero reversal zone sits between roughly 400 and 440. This range acted as a major support area during the recent decline and aligns with deep retracement levels from the prior rally. Buyers have previously shown interest here, making it a logical area for price to pause or bounce.
Within this range, one level stands out. A daily close below approximately 411 would be a significant bearish signal. Such a move would indicate that buyers are losing control and that the corrective phase may not be finished. If that happens, market structure would weaken further, increasing the risk of additional downside.
As long as price holds above this zone, however, the possibility of stabilization remains alive. Sideways movement or a slow grind higher from this area could suggest accumulation rather than panic selling.
Upside Levels to Watch if a Bounce Occurs
If Monero manages to hold support and push higher, several resistance zones come into play. The first area of interest lies near the 500 to 510 region. This zone represents a prior area of heavy trading activity and could attract sellers on any rebound.
Above that, a second resistance band between roughly 560 and 580 is likely to act as a stronger barrier. These levels are considered liquidity zones where price reactions are common. A clean break above them would be needed to confirm a meaningful reversal rather than a temporary bounce.
Until those resistance levels are reclaimed, any upside movement may be viewed as corrective rather than trend-changing.
Common Trading Approaches Around These Zones
Given the current structure, many traders are adopting a cautious approach. One popular strategy is selling into strength. This means waiting for price to bounce toward resistance zones and using those rallies to reduce exposure or take profits.
This approach reflects the uncertainty in the market. Without clear confirmation of renewed bullish momentum, traders prefer to protect capital rather than aggressively chase rebounds. A strong rejection at resistance would support this strategy, while a decisive breakout would invalidate it.
Confirmation remains key. A sustained move above resistance would signal improving strength, while a breakdown below support would confirm bearish continuation.
What Would Confirm a Bearish or Bullish Shift
A confirmed bearish shift would occur if price closes decisively below the main support zone, especially under the 411 level. That would suggest that selling pressure is still dominant and that lower levels may be tested.
On the other hand, a bullish shift would require more than just a short-term bounce. Price would need to reclaim key resistance zones and establish higher lows. That would indicate that buyers are regaining control and that the correction phase may be ending.
Until one of these scenarios plays out, Monero remains in a critical evaluation phase.
Editor’s View:
What stands out in this pullback is not just the depth of the retracement, but how orderly it has been. Sharp declines driven by panic often show erratic wicks and accelerated volume spikes, yet Monero’s move lower has unfolded in defined steps, suggesting distribution rather than fear. This usually reflects larger participants adjusting exposure gradually instead of exiting under pressure. In that context, price behavior around key support zones may reveal more about positioning shifts than about sentiment extremes.
Final Outlook on Monero Reversal Zones
Monero Reversal Zones are currently shaping the outlook for XMR. The sharp retracement from recent highs has brought price into areas that historically attract strong reactions. Whether these zones hold or fail will likely determine the next major trend direction.
Holding above support keeps the bullish structure intact, even if progress is slow. Losing that support, however, would open the door to further weakness. With broader market conditions still uncertain, traders are watching these levels closely and adjusting their strategies accordingly.
Patience and confirmation remain essential as Monero navigates this high-stakes zone of the chart.
Disclaimer: This content is for informational purposes only and does not constitute financial advice.
Keep yourself updated with the latest crypto news with FYI Gazette
Read more about Memecoins with FYI Gazette
Keep yourself updated with the latest Altcoin News with FYI Gazette
 Bitcoin
  Ethereum
  Tether
  BNB
BNB  XRP
XRP  Solana
  TRON
TRON  Dogecoin
  Litecoin
  Pepe
Pepe