
Axie Infinity Price Slides as Selling Pressure Grows
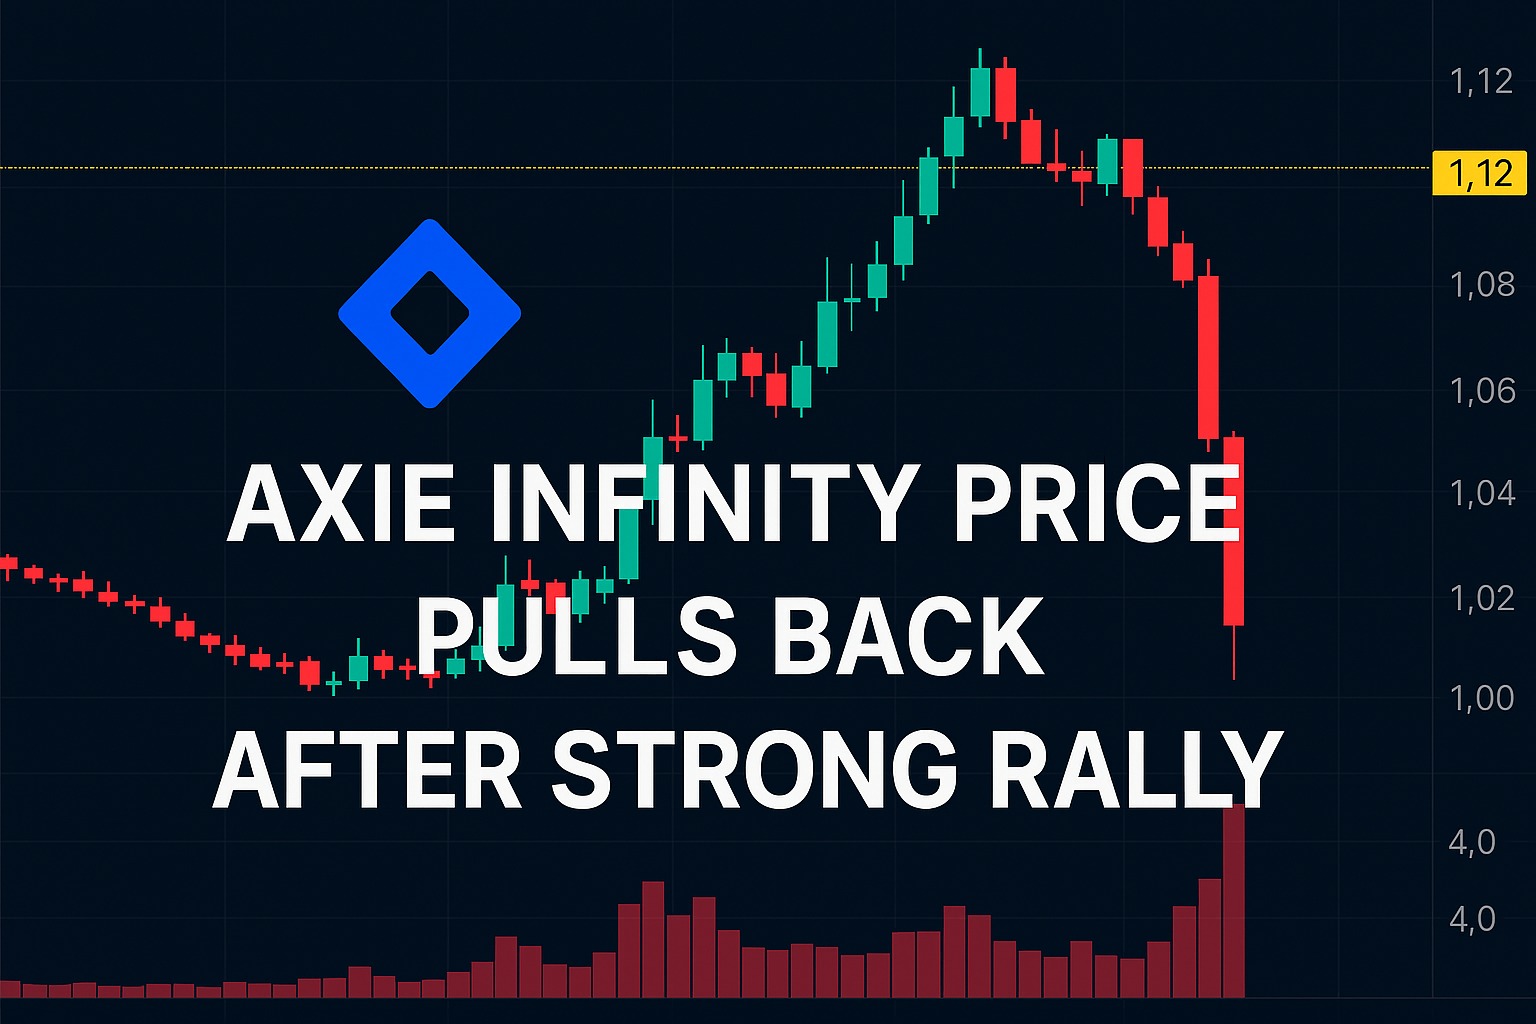
Axie Infinity Price has entered a corrective phase after a strong rally earlier this week, catching the attention of traders watching short-term momentum. After climbing sharply over several days, the token pulled back by more than 7 percent, signaling that selling pressure has started to outweigh buying demand. This move follows a surge in exchange inflows, which often points to investors preparing to sell rather than hold.
The recent decline comes after Axie Infinity Price gained nearly 37 percent in a short period. Such fast price increases are often followed by profit-taking, especially when on-chain data shows rising activity on centralized exchanges. In this case, exchange netflow reached its highest level in three years, reinforcing concerns that the recent upside move may be losing strength.
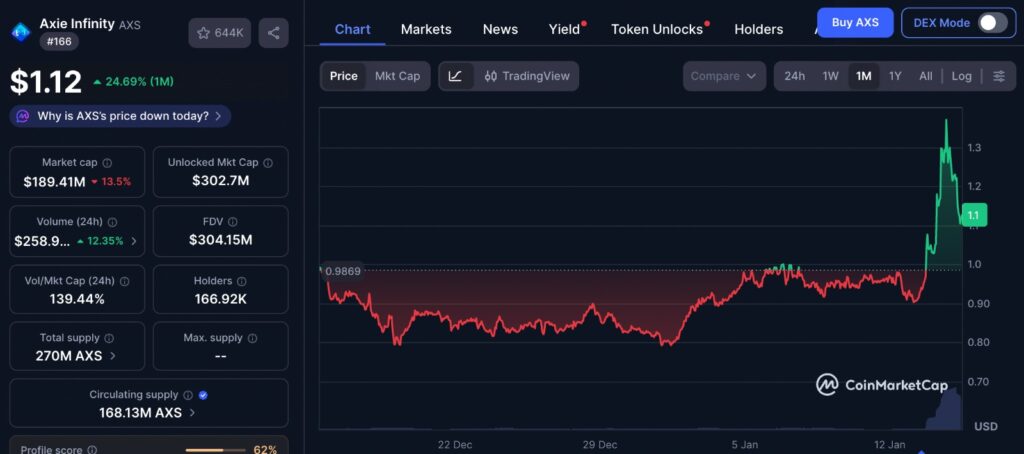
Viewed over the past month, the price chart highlights how quickly sentiment around AXS can shift once momentum appears. Extended periods of sideways movement were followed by a sharp upward burst, which was then met with an equally quick pullback. This pattern suggests that recent volatility has been driven more by short-term positioning than by a steady change in conviction. The chart reflects a market still searching for balance, where price reactions remain sensitive to sudden changes in participation rather than sustained demand.
Axie Infinity Price Pulls Back After Strong Rally
Axie Infinity Price dropped below the 1.12 level after failing to hold recent highs. The decline reflects a shift in sentiment as traders lock in gains from the earlier rally. When prices move up quickly, short-term holders often sell to secure profits, which can lead to sudden pullbacks even if the broader trend remains intact.
This behavior is visible in exchange netflow data, which tracks how many tokens are moving into and out of exchanges. A positive netflow means more tokens are being sent to exchanges, usually for selling. Recently, Axie Infinity recorded an exchange netflow of around 2.10 million tokens, the highest reading seen in more than three years.
Exchange Netflow and Selling Pressure
The spike in exchange netflow is one of the most important signals behind the current weakness in Axie Infinity Price. Large inflows suggest that holders are preparing to sell rather than store tokens in private wallets. This type of activity often increases available supply on the market, putting downward pressure on price.
High exchange inflows do not always mean a long-term bearish trend, but they frequently lead to short-term corrections. In this case, the timing of the netflow surge aligns closely with the recent price drop, strengthening the argument that profit-taking is driving the move lower.
Derivatives Data Turns Bearish for Axie Infinity Price
Derivatives market data also supports the cautious outlook for Axie Infinity Price. Funding rates, which show the balance between long and short positions, have recently turned negative. When funding rates drop below zero, it means short sellers are dominating and paying fees to long traders, reflecting bearish expectations.
In addition, the long-to-short ratio has fallen below one, indicating that more traders are betting on price declines than price increases. The ratio recently stood near 0.82, showing a clear bias toward short positions. This shift in derivatives positioning often increases volatility, as leveraged traders react quickly to price movements.
Negative funding rates and a low long-to-short ratio together suggest that many traders expect further downside in the short term. These conditions can amplify price drops if selling accelerates, especially during periods of weaker overall market sentiment.
Key Technical Levels for Axie Infinity Price
From a technical perspective, Axie Infinity Price is approaching important support zones. After breaking below a key Fibonacci retracement level, the token is now testing the 50-day Exponential Moving Average. This moving average often acts as dynamic support during corrections.
If the price closes below this level, it could open the door for a deeper pullback toward the previous weekly low near 0.90. Such a move would represent a larger retracement of the recent rally and could shake out weaker hands before a potential stabilization.
Momentum indicators show mixed signals. The Relative Strength Index has moved lower from overbought levels, suggesting that bullish momentum is cooling. At the same time, the Moving Average Convergence Divergence indicator still shows a bullish crossover, indicating that the broader trend has not fully turned negative yet.
This combination of weakening momentum and lingering bullish structure creates uncertainty. Price may continue to consolidate or dip further before a clearer direction emerges.
What Traders Should Watch Next
For traders monitoring Axie Infinity Price, exchange netflow and derivatives data remain key indicators to follow. A decline in exchange inflows would suggest reduced selling pressure and could support price stabilization. Similarly, a shift in funding rates back toward positive territory would indicate renewed confidence among long traders.
Short-term traders may focus on support levels around the 50-day moving average and the recent swing low. A strong bounce from these zones could attract buyers looking for another upward move. However, failure to hold support may increase the risk of further downside.
Longer-term participants often view corrections after strong rallies as normal market behavior. As long as price remains above major structural support levels, the broader outlook may remain constructive despite short-term weakness.
Editor’s View: Market Behavior Beyond the Data
What stands out in this move is not just the indicators, but the timing. After a long period of muted interest, a sudden price surge often attracts short-term participants who are less committed to the asset itself and more focused on momentum. When that kind of crowd enters quickly, exits tend to follow just as fast, especially once early gains are visible. This behavior can create sharp reversals that look dramatic on charts but are largely driven by psychology rather than a shift in underlying fundamentals.
Outlook for Axie Infinity Price
Axie Infinity Price is currently adjusting after an aggressive rally, with both on-chain and derivatives data pointing to caution in the near term. The sharp rise in exchange inflows and the shift toward bearish derivatives positioning suggest that sellers have gained temporary control.
Still, not all signals are negative. Some technical indicators continue to support the idea that the recent pullback could be corrective rather than the start of a prolonged downtrend. Market direction will likely depend on whether selling pressure eases and buyers regain confidence.
In the coming days, traders will watch closely for changes in exchange behavior, funding rates, and price reaction at key support levels. These factors will help determine whether Axie Infinity Price can stabilize and recover or whether further downside remains likely.
Overall, the current price action highlights how quickly sentiment can change in cryptocurrency markets. By tracking both technical and on-chain indicators, traders can better navigate the short-term uncertainty surrounding Axie Infinity Price while staying prepared for the next significant move.
Disclaimer: This content is for informational purposes only and does not constitute financial advice.
Keep yourself updated with the latest crypto news with FYI Gazette
Read more about Memecoins with FYI Gazette
Keep yourself updated with the latest Altcoin News with FYI Gazette
 Bitcoin
  Ethereum
  Tether
  XRP
XRP  BNB
BNB  Solana
  Dogecoin
  Litecoin
  Pepe
Pepe