
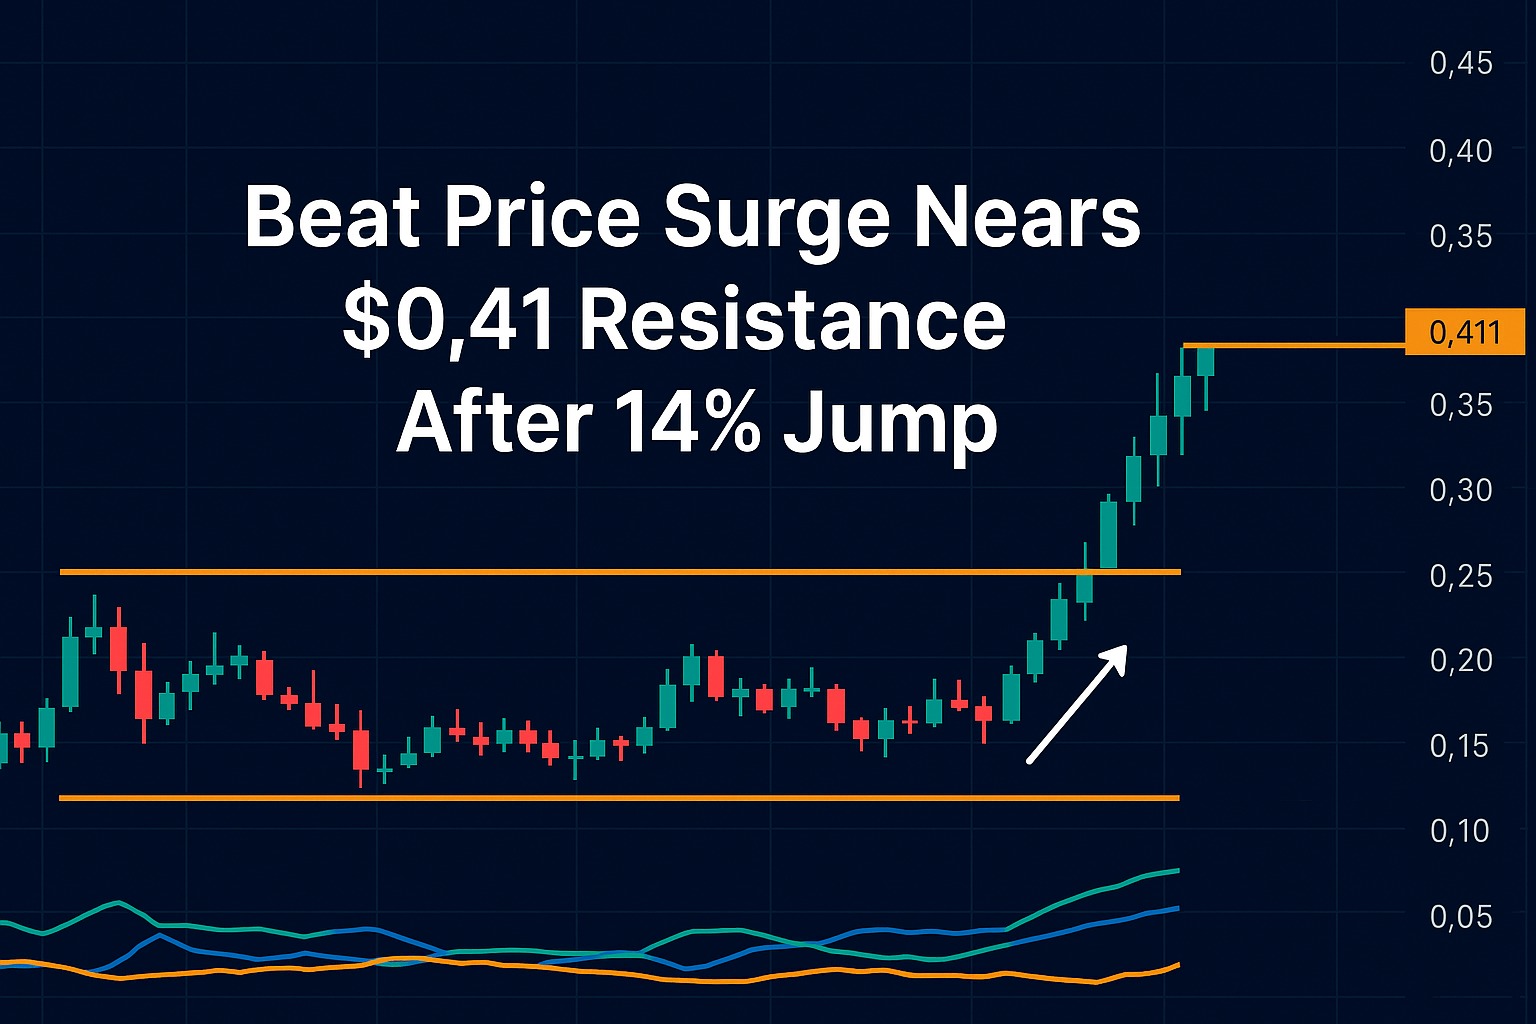
Beat Price Surge Nears $0.41 Resistance After 14% Jump
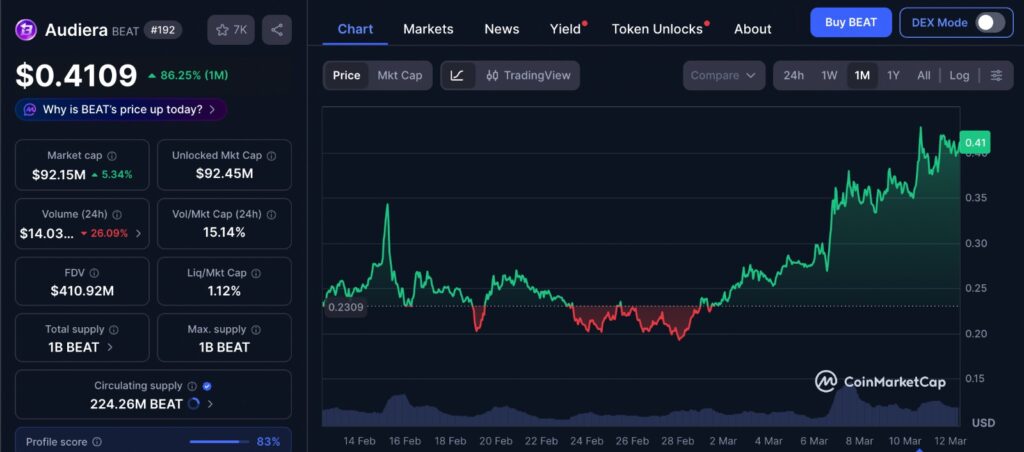
Beat Price Surge has captured strong market attention after Audiera’s BEAT token climbed 14.09% in the past 24 hours, reaching $0.3979 as trading activity expanded rapidly across the market. During the same period, trading volume jumped 69.74% to around $19.14 million, signaling a sharp increase in market participation. The sudden rise in activity suggests that traders have begun positioning more aggressively as buyers continue pushing price toward the upper boundary of its broader consolidation structure.
This rally is unfolding while BEAT approaches an important technical level near $0.41. Historically, this zone has acted as a strong resistance barrier where price movements have repeatedly stalled. When markets approach such levels alongside rising liquidity, it often reflects growing trader interest and strategic positioning ahead of a potential breakout attempt.
At the same time, the increase in transaction activity indicates expanding liquidity across spot markets. However, BEAT now sits close to a historically reactive resistance zone. Because of this positioning, the market is closely watching whether the rally can maintain its strength or whether sellers will begin defending the resistance area.
The latest 1-month price chart shows how the recent Beat rally developed within a broader consolidation structure. After spending much of the past month fluctuating within a defined range, the token gradually regained upward momentum as buying activity increased. The steady climb toward the upper boundary of the range highlights how sentiment shifted as traders began reacting to rising volume and strengthening participation. At the same time, the chart illustrates how closely the current price now sits near the range high, an area where market reactions have historically intensified.
Beat Price Surge Tests the Upper Range Boundary
The ongoing Beat Price Surge has pushed the token toward the upper edge of a consolidation structure that has defined its price behavior for several months. Over this period, BEAT has traded between roughly $0.1509 on the lower end and $0.4098 near the upper boundary, forming a clearly defined trading range.
Recently, the token rebounded strongly from the lower portion of this range. After earlier declines pushed the asset toward support levels, buyers gradually regained control and began driving price upward again. This recovery phase allowed BEAT to reclaim lost ground and steadily climb toward the resistance ceiling.
Now the market is once again testing the $0.4098 resistance area. This level has repeatedly capped upward movement in the past, making it an important zone for traders to monitor. When price approaches a well established resistance level, both buyers and sellers often increase their activity as they attempt to control the next directional move.
Repeated pressure on resistance can sometimes weaken the available sell side liquidity. If buyers continue testing the same boundary without strong rejection, the chances of a structural breakout tend to increase over time.
Beat Price Surge Shows Strength Through Technical Indicators
Technical indicators currently support the strengthening momentum behind the Beat Price Surge. Data from the Directional Movement Index suggests that buying pressure has recently gained the upper hand over selling activity.
The positive directional index has climbed to 36.82, while the negative directional index remains lower near 30.78. This difference shows that buyers have maintained stronger influence throughout the recent rally.
When the positive index stays above the negative index, it generally reflects an environment where bullish momentum is dominating short term market behavior. In addition to this, the Average Directional Index remains elevated, suggesting that the underlying trend has been strengthening rather than weakening.
A rising ADX reading often indicates that a developing trend is becoming more established and gaining stability. However, the relatively small gap between the positive and negative directional lines also suggests that sellers have not completely lost influence near resistance levels.
Because of this balance, continued expansion in the positive directional index would strengthen the argument for a breakout attempt above the $0.41 resistance level.
Exchange Inflows Appear During Beat Price Surge
While price momentum has strengthened, exchange flow data reveals another development occurring during the Beat Price Surge. Recent market activity shows that traders have been moving additional BEAT tokens onto exchanges.
Netflow data indicates that approximately $132,990 worth of BEAT has entered exchange platforms during the latest observation period. When tokens move onto exchanges, it typically increases the supply available for immediate trading within the market.
Such inflows can sometimes signal that traders are preparing to sell or adjust their positions. Investors often move assets onto exchanges when they anticipate potential price reactions or when they want to secure profits following a rally.
The timing of these inflows is notable because price is currently approaching the key resistance area near $0.41. As a result, some participants may be acting cautiously while the rally tests its upper boundary.
If selling pressure increases around this level, the additional supply entering exchanges could slow upward momentum. However, strong buying demand may still absorb these tokens if market interest continues expanding.
Derivatives Activity Expands Alongside Beat Price Surge
Derivatives markets are also reflecting increased participation during the Beat Price Surge. Futures data shows that open interest has grown by approximately 14.83%, reaching around $38.40 million.
Open interest measures the total number of active futures contracts that remain open in the market. When this metric rises during a price rally, it usually indicates that new positions are being opened rather than older positions being closed.
This type of expansion often signals that fresh capital is entering the market. Traders may be positioning themselves in anticipation of further price movement as the asset approaches a key resistance level.
However, rising open interest can also introduce greater volatility. Leveraged positions tend to amplify market reactions, especially when price approaches important technical boundaries. If the market experiences a sharp move, liquidation events can intensify price swings.
For now, the increase in derivatives activity suggests that traders are actively positioning themselves around the critical resistance level near $0.41.
Editor’s View: Why Traders Focus on Range Highs
Markets often become most active when price approaches the upper boundary of a long consolidation range. Levels like BEAT’s $0.41 resistance tend to attract attention because traders who bought lower begin evaluating whether to secure profits, while new participants watch closely for signs of a structural shift. This creates a natural tension between supply from earlier buyers and demand from traders anticipating momentum. The behavior around such levels often reveals more about market conviction than the rally itself.
Market Structure Behind the Beat Price Surge
The broader structure surrounding the Beat Price Surge highlights a potentially decisive moment for the token. Price currently sits near the top of its long standing consolidation range while trading activity continues expanding across both spot and derivatives markets.
Strong price recovery, rising Directional Movement Index strength, and increasing open interest all indicate growing market participation. These signals show that traders are paying close attention to the current resistance zone.
At the same time, exchange inflows suggest that some holders may be preparing to take profits as price approaches resistance. This creates a natural balance between buyers attempting to extend the rally and sellers looking to secure gains.
If buying demand remains strong enough to absorb incoming supply, BEAT could move beyond the $0.41 resistance level and exit its long standing consolidation structure. However, if selling pressure intensifies near resistance, the token may continue trading within its established range until stronger momentum develops.
Disclaimer: This content is for informational purposes only and does not constitute financial advice.
Keep yourself updated with the latest crypto news with FYI Gazette
Read more about Memecoins with FYI Gazette
Keep yourself updated with the latest Altcoin News with FYI Gazette
 Bitcoin
  Ethereum
  Tether
  BNB
BNB  XRP
XRP  Solana
  Dogecoin
  Litecoin
  Pepe
Pepe