
Crypto Bottom Bitcoin Nears Max Pain Zone
Crypto Bottom discussions have intensified as Bitcoin drops toward critical levels linked to major institutional cost bases. Analysts suggest that the current decline is pushing BTC closer to a zone known as the max pain range, where investor sentiment weakens, volatility rises, and long term buying opportunities often emerge. As Bitcoin approaches these lower boundaries, both retail and institutional holders are watching closely for signs of capitulation or renewed accumulation.
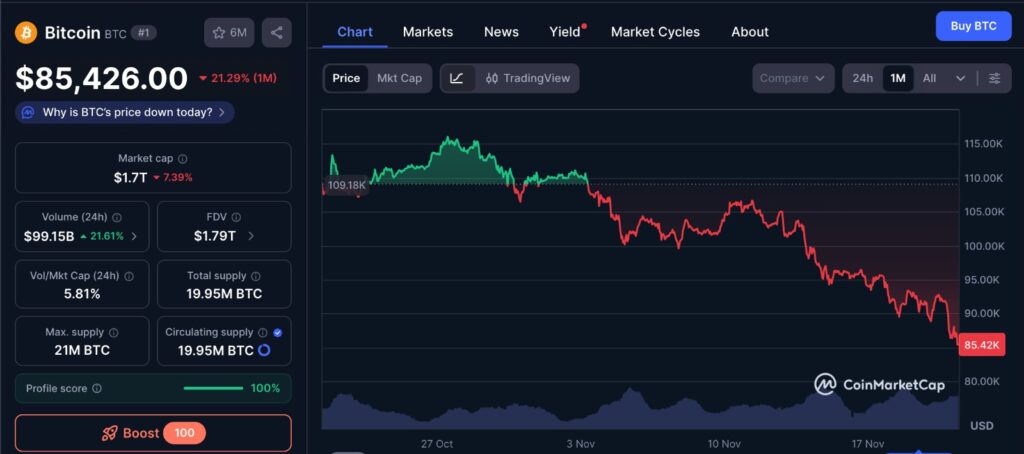
The included one month Bitcoin price chart from CoinMarketCap adds visual context to the broader market discussion. The recent price action shows a steady retreat from the highs of earlier weeks, reflecting the same weakening sentiment noted across institutional flows and liquidity trends. Short term volatility is evident in the series of lower highs and lower lows, reinforcing the idea that Bitcoin is currently navigating the max pain zone highlighted by analysts. This chart helps illustrate how momentum has cooled and why the market is carefully watching for signs of either deeper capitulation or the first stages of renewed accumulation.
Understanding the Crypto Bottom concept
The idea of a Crypto Bottom refers to the price area where Bitcoin historically finds strong support after severe corrections. Analysts from Bitwise Asset Management highlight a range between 84000 and 73000 dollars as the critical zone. This range reflects the cost basis of major holders, including the IBIT spot bitcoin ETF and the corporate treasury positions of MicroStrategy. When the market enters this band, pressure typically builds as investors face increasing unrealized losses, raising the risk of emotional selling. At the same time, such levels often attract buyers who view the decline as a chance to accumulate at a discount.
Why the cost basis range matters for the Crypto Bottom
IBIT and investor psychology
IBIT, one of the largest spot bitcoin exchange traded funds, has an average cost basis estimated around 84000 dollars. When Bitcoin trades below that level, ETF holders begin to experience losses on the majority of their holdings. This can lead to heightened outflows, and recent activity reflects that pattern. IBIT recorded its largest single day outflow of over 500 million dollars, and total outflows exceeded 3.3 billion dollars in the span of thirty days. Such departures tighten liquidity and weaken market sentiment, pushing Bitcoin closer to the conditions associated with a potential Crypto Bottom.
MicroStrategy and corporate treasury pressures
MicroStrategy is one of the most well known corporate holders of Bitcoin. Its average purchase price is near 73000 dollars, marking another important level within the max pain range. As Bitcoin retreats toward this number, the company faces increased scrutiny from the market. Its net asset value recently dipped below 1, meaning the companys equity was trading at a discount to the value of its Bitcoin holdings. This signals tightening financial conditions and reduced confidence from investors. When large entities face pressure around their cost basis, the broader market tends to feel additional stress.
Macro factors that shape the Crypto Bottom outlook
Liquidity and stablecoin reserves
One notable factor in assessing whether the market is nearing a Crypto Bottom is the level of stablecoin reserves held on exchanges. A record amount of more than 72 billion dollars in stablecoins is currently available, which historically precedes major buying phases. High reserve levels indicate that investors have significant dry powder ready for deployment once confidence returns. This pattern appeared in earlier market cycles and often aligns with periods of undervaluation.
Federal Reserve uncertainty
Another major influence is the changing expectations around interest rate decisions from the Federal Reserve. Market projections for a rate cut at the upcoming meeting have dropped to below 50 percent. If the Fed delays easing, liquidity conditions remain tight, which can prolong Bitcoins downward pressure. Additionally, labour market reports were delayed due to a temporary government shutdown, leaving policymakers with limited data. This adds an extra layer of uncertainty to an already fragile environment.
What investors can expect during the Crypto Bottom phase
A combination of fear and opportunity
The max pain zone is aptly named because it represents both emotional and financial stress for many participants. Investor sentiment often deteriorates as prices approach the lower boundaries of their cost basis. According to Bitwise analysts, Bitcoin may be forming what they call a final cycle bottom within the 84000 to 73000 dollar zone. While stress is high, this region can also present significant long term buying opportunities for those who believe in the broader Bitcoin narrative.
Patience and timing
Predicting exact bottoms is extremely difficult and often counterproductive. Instead, investors tend to benefit from watching for signs such as slowing outflows, renewed accumulation by large holders, and stronger liquidity conditions. The timing may vary, and the price could remain within the max pain range for an extended period before a clear reversal occurs.
Potential Bitcoin trading range if conditions remain tight
Analysts estimate that if macro liquidity does not improve, Bitcoin could trade between 60000 and 80000 dollars for the remainder of the year. This broader range reflects the possibility of slow recovery phases following periods of intense selling. Within this range, however, the 84000 to 73000 dollar band remains a primary focus since it aligns with the cost bases of major institutional actors.
Key signals to monitor around the Crypto Bottom
ETF flows
Tracking inflows and outflows from major spot ETFs offers clear signals about institutional sentiment. Heavy outflows may indicate ongoing stress, while stabilizing flows often precede recoveries.
Corporate treasury activity
Companies such as MicroStrategy provide insight into how large balance sheet holders respond to market volatility. Their decisions can influence both narrative and investor confidence.
Macroeconomic updates
Inflation data, Federal Reserve statements, and economic indicators all shape liquidity conditions. Positive shifts can help push Bitcoin out of a prolonged downturn.
Stablecoin movements
High stablecoin reserves indicate strong potential buying power. When reserves begin converting into active market positions, sentiment typically improves.
Final thoughts on approaching the Crypto Bottom
The Crypto Bottom scenario highlights a pivotal moment for Bitcoin as it enters the max pain zone. This region aligns with the cost basis of major ETFs and corporate holders, making it a sensitive area for market behaviour. While sentiment may weaken and volatility may rise, the same conditions often create attractive opportunities for long term investors. As always, careful monitoring, patience, and disciplined decision making are essential when navigating periods of uncertainty.
Keep yourself updated with the latest crypto news with FYI Gazette
Read more about Memecoins with FYI Gazette
Keep yourself updated with the latest Altcoin News with FYI Gazette
 Bitcoin
  Ethereum
  Tether
  XRP
XRP  BNB
BNB  Solana
  Dogecoin
  Litecoin
  Pepe
Pepe