
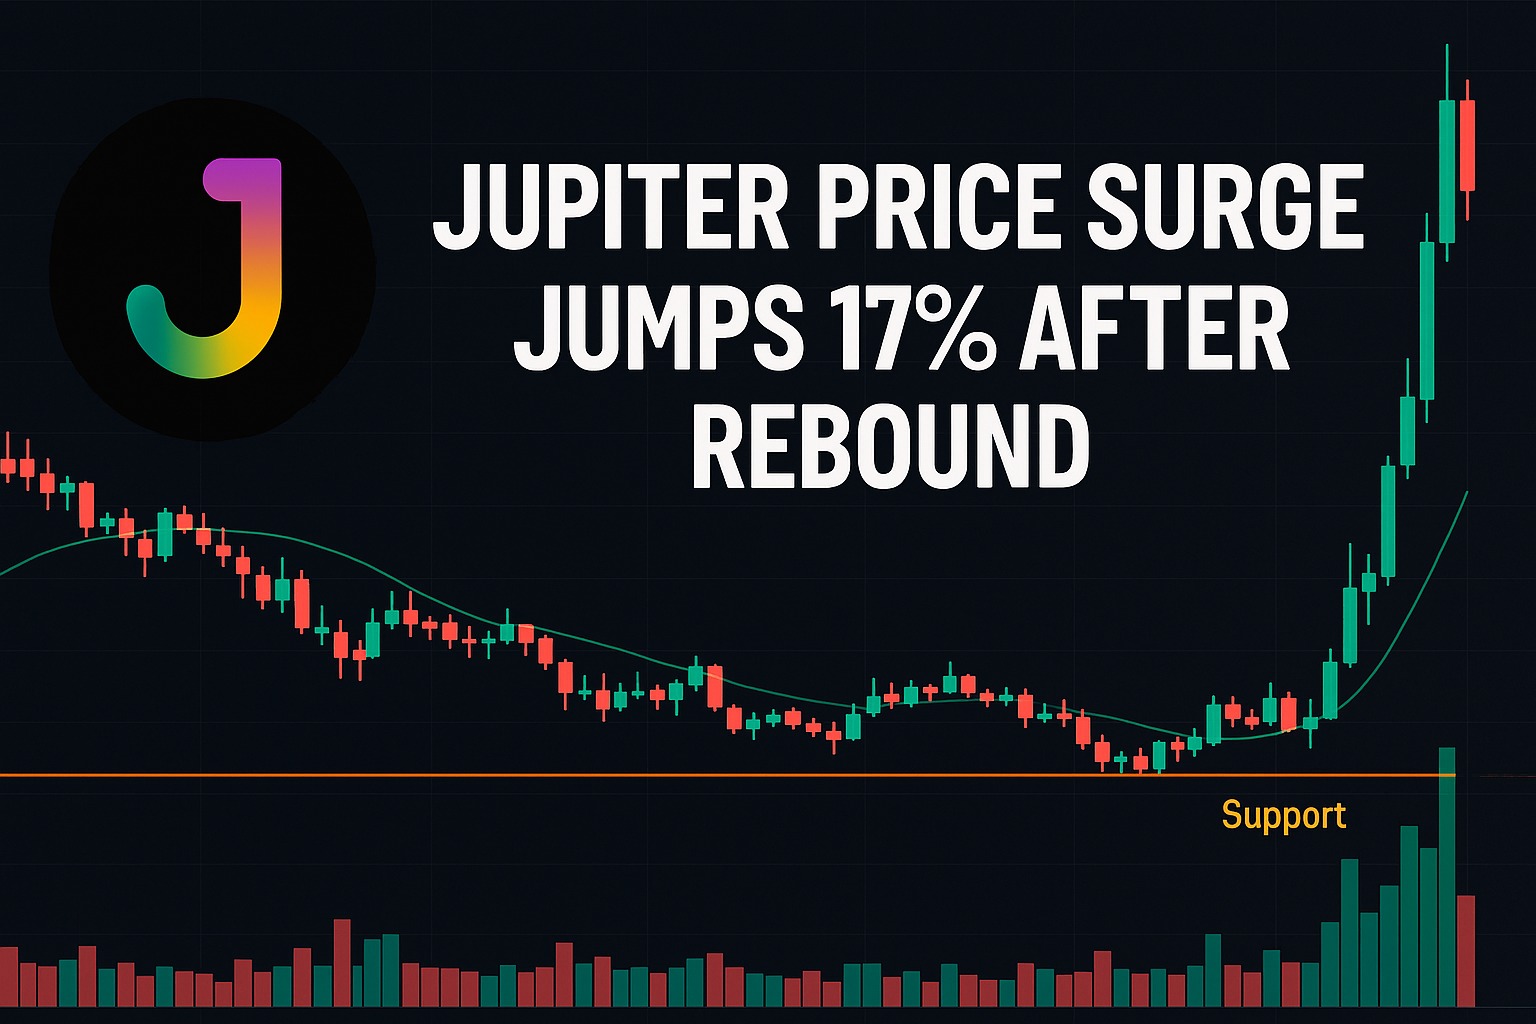
Jupiter Price Surge Jumps 17% After Rebound
Jupiter Price Surge lifted the Solana based token by 17 percent after a strong rebound from support, but derivatives traders are still positioning for downside. The recovery followed a period of weakness that had pushed JUP toward a key demand zone. Buyers stepped in decisively at that level, triggering a sharp move higher. Despite the rally, funding data suggests many traders remain cautious about the sustainability of this advance.
The bounce occurred after JUP tested a previously defended support region. This area had acted as a floor in the past, and once price approached it again, buying interest returned. The reaction was swift, with the token climbing rapidly and reclaiming short term resistance levels that had previously limited upside attempts.
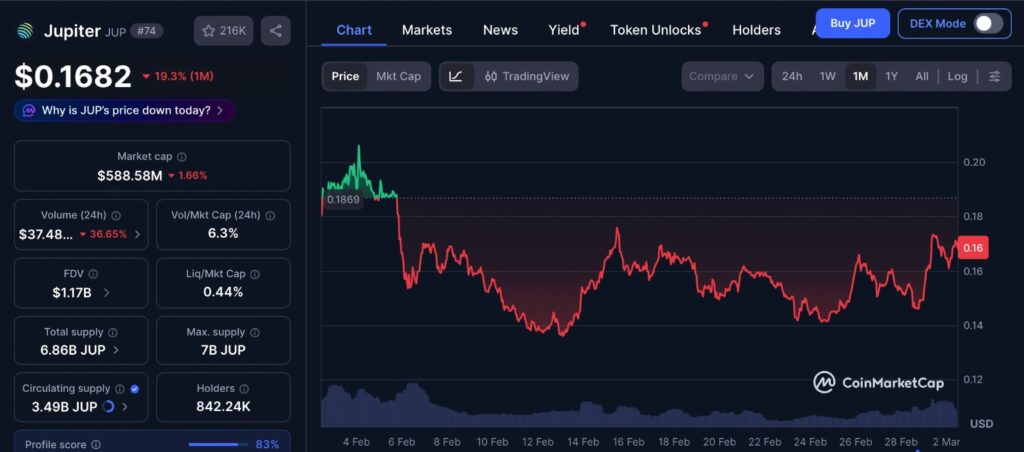
The one month chart from CoinMarketCap shows how the Jupiter Price Surge developed within a broader period of volatility. JUP had been trending lower before stabilizing near support, where buying pressure gradually returned. The recent rebound stands out clearly against the earlier pullback, highlighting how quickly sentiment can shift once a key level is defended. At the same time, the chart reflects that price is still operating within a wider range rather than a confirmed long term breakout, which helps explain the mixed positioning seen in derivatives markets.
Jupiter Price Surge Reclaims Strength From Key Support
The recent rebound marks an important shift in short term structure. Before the rally, JUP had been forming lower highs and lower lows, signaling persistent selling pressure. The bounce interrupted that pattern and introduced a more constructive setup on the daily timeframe.
As price advanced, technical indicators began reflecting improving momentum. The Relative Strength Index moved upward from lower levels, showing that bearish pressure was easing. At the same time, price action broke above near term resistance zones, which often signals that buyers are regaining control.
Volume also increased during the rally. Rising volume during upward movement typically strengthens the credibility of a breakout or rebound. It indicates that participation is expanding rather than the move being driven by limited liquidity.
Reclaiming these technical levels has helped shift short term sentiment. However, maintaining those gains will be crucial for confirming whether the Jupiter Price Surge can evolve into a more sustained trend rather than just a temporary recovery.
Derivatives Markets Show Skepticism After Jupiter Price Surge
While spot markets reflected bullish momentum, derivatives data painted a more cautious picture. Open Interest increased as the price moved higher, showing that new positions were entering the market. Rising Open Interest during a rally can indicate growing engagement, but it does not automatically confirm bullish conviction.
More notably, funding rates turned negative. A negative funding rate suggests that short positions are dominant, meaning traders betting on a decline are paying those holding long positions. This signals that a significant portion of the derivatives market expects a pullback despite the recent rally.
The divergence between rising price and negative funding highlights the tension in current positioning. Spot buyers have driven price upward, but leveraged traders appear hesitant to fully embrace the upside. Instead, many are positioning for the possibility that the rally could stall.
This imbalance creates a dynamic environment. If price continues rising, short sellers may face pressure, potentially fueling further upside through liquidations. On the other hand, if momentum fades, the existing short bias may prove justified.
Liquidation Pressure Around the Jupiter Price Surge
As JUP climbed, short positions became vulnerable. When traders open leveraged shorts and price rises sharply, they can be forced to close those positions. This process, known as short liquidation, results in additional buy orders that can accelerate upward movement.
The recent 17 percent rebound likely included elements of short covering. Once price pushed above certain levels, liquidation clusters may have triggered automatic position closures, adding to buying pressure.
At the same time, liquidity pools remain above and below the current price. Markets often gravitate toward areas where large concentrations of leveraged positions are placed. These zones can act as magnets, increasing the probability of volatile swings as traders are forced to react.
Because of this structure, the Jupiter Price Surge may not represent the end of volatility. Instead, it could mark the beginning of a more active phase as both bulls and bears defend their respective positions.
Technical Indicators Supporting the Jupiter Price Surge
From a technical perspective, momentum indicators turned more constructive during the rebound. The Moving Average Convergence Divergence indicator showed a bullish shift as the histogram moved into positive territory. This transition typically reflects improving buying momentum.
Meanwhile, the RSI climbed away from oversold conditions. When RSI recovers from lower levels and trends upward, it often confirms that sellers are losing dominance in the short term.
Price also managed to reclaim short term moving averages. These dynamic resistance levels frequently influence algorithmic and trend based strategies. Breaking above them can attract additional buying interest, especially from traders who follow systematic setups.
However, sustaining these reclaimed levels remains critical. A failure to hold above them could reintroduce selling pressure and reinforce the bearish bias reflected in funding rates.
Editor’s View: Why Traders Are Fading the Jupiter Price Surge
Rebounds like this often expose the difference between reactive buyers and cautious positioning. When a token drops sharply and then bounces, some traders step in quickly, seeing value at support, while others treat the move as a temporary relief rather than a structural shift. The negative funding rate suggests that many participants are not convinced the broader sentiment has changed, even if the chart looks stronger in the short term. In markets that have recently shown weakness, rallies are frequently tested by skepticism before confidence returns.
What Comes Next After the Jupiter Price Surge
The 17 percent rebound demonstrates that JUP continues to attract buyers at important support levels. The ability to defend these zones suggests that demand remains active. Yet the persistent negative funding rate reveals that confidence is not universal.
This push and pull between spot market optimism and derivatives market caution creates a balanced but fragile structure. Bulls have shown strength by reversing the recent decline, but bears have not stepped aside completely.
For the rally to gain broader acceptance, price may need to consolidate and establish stability above recently reclaimed levels. Sustained strength could gradually shift sentiment and force short sellers to reconsider positioning. Conversely, renewed weakness could validate the cautious stance currently visible in derivatives data.
The Jupiter Price Surge highlights how quickly crypto markets can shift when key technical levels are defended. A strong rebound can alter short term structure in a matter of days. However, underlying positioning often reveals whether conviction is widespread or divided.
At present, JUP sits at a pivotal point. Momentum has improved, support has held, and price has rebounded sharply. Yet skepticism in the derivatives market shows that traders remain alert to potential downside. The next phase will likely depend on whether buyers can maintain pressure in the face of lingering bearish expectations.
Disclaimer: This content is for informational purposes only and does not constitute financial advice.
Keep yourself updated with the latest crypto news with FYI Gazette
Read more about Memecoins with FYI Gazette
Keep yourself updated with the latest Altcoin News with FYI Gazette
 Bitcoin
  Ethereum
  Tether
  BNB
BNB  XRP
XRP  Solana
  Dogecoin
  Litecoin
  Pepe
Pepe