
Monero XMR Faces Real Test Ahead
Monero XMR begins the discussion at the center of its current market crossroads. After a strong upward breakout in November, the privacy-focused cryptocurrency has reached a point where its trend strength faces a meaningful challenge. Traders and long-term holders are now paying close attention to whether momentum can carry forward or whether the recent pullback signals a deeper correction ahead. Understanding the latest price behavior, market structure, and chart indicators gives a clearer picture of what may unfold next.
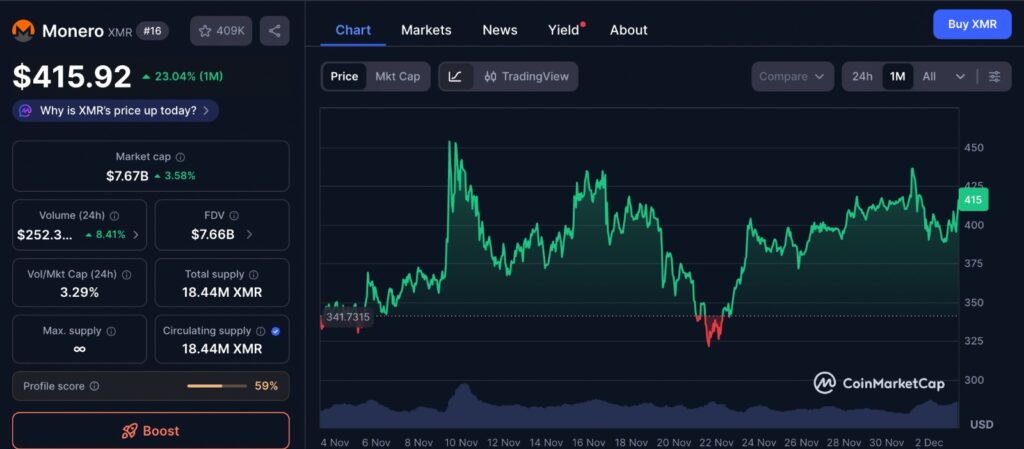
The chart of Monero’s price action over the past month highlights the transition from its early-November rally into the recent consolidation phase. The visual trend shows how XMR climbed steadily before encountering resistance near the 440 zone, followed by the pullback that aligned with broader market weakness. This one-month snapshot also reinforces the tightening range currently forming, suggesting that traders are waiting for a decisive break above resistance or a retest of lower support levels. The image provides helpful context for understanding the shift in momentum and why the next move could set the tone for XMR’s short-term direction.
Monero XMR Price Action After the November Surge
The performance of Monero XMR in November stood out as one of the brighter spots in a generally shaky crypto market. Early in the week following its November breakout, the coin climbed toward the 440 level, a resistance zone that has historically acted as a difficult ceiling. Shortly after touching this region, however, the broader crypto market experienced sharp pressure when Bitcoin slipped below the 90,000 mark. This pullback dragged many altcoins downward, and Monero XMR was no exception.
From its local high near 440, the coin recorded roughly a 10 percent decline. While that move was notable, it did not erase the broader upward trend that had been building since early November. During that period, Monero XMR posted gains of more than 15 percent, outperforming several other privacy-focused assets. This relative strength becomes more impressive when compared to the steep declines of rivals such as ZCash and Dash, both of which suffered sizable drops during the same timeframe.
How Monero XMR Compares to Other Privacy Coins
Looking at other assets in the privacy coin category helps put Monero XMR’s performance into perspective. ZCash experienced an extraordinary rally in previous months, climbing more than 700 percent from its earlier lows. In comparison, Monero XMR saw a much more modest increase of slightly above 50 percent over the same broad period. Even so, the coin showed more stability in recent weeks, avoiding the sharper downturns seen across ZCash and Dash.
This steadiness makes Monero XMR noteworthy for traders seeking assets that combine trend strength with lower volatility. While its overall growth has not been as explosive as some competitors, its ability to hold ground through choppy market conditions keeps it in focus for both technical and fundamental analysis.
Monero XMR Trend Structure Remains Generally Bullish
Zooming out to the weekly timeframe shows that Monero XMR has already broken above an earlier resistance zone near the 420 level. This breakout suggests the presence of a larger bullish structure. Should momentum continue, the next major long-term target sits near the 518 area, which represents a prior cycle high reached in 2021.
On the daily chart, the structure still leans bullish but has become more complicated due to the recent rejection around 438 to 440. This rejection created a short-term imbalance in price that may lead the market to revisit the 360 zone. This area has technical significance because it acted as a previous consolidation level and contains an unfilled gap that traders consider a potential magnet for price.
Market Indicators for Monero XMR
Technical indicators offer additional clues about the health of Monero XMR’s trend. On the weekly timeframe, the money flow index signals visible capital inflows, which typically supports a continuation of upward momentum. Weekly MACD readings also remain in positive territory, reinforcing this broader trend bias.
The picture changes slightly on the daily chart, where indicators appear mixed. Both the daily money flow index and MACD show uncertainty, hinting that bullish energy has weakened in the short term. This imbalance between daily and weekly indicators often marks transition periods where the market prepares for either a deeper pullback or a renewed push upward.
Another important tool for analysis is the liquidation map. Data shows that long liquidations between 355 and 360 carry significant leverage, suggesting that if selling pressure increases, price could be drawn toward that zone. At the same time, heavily leveraged short positions cluster between 440 and 450. If price moves upward and challenges those levels again, a short squeeze could drive a stronger breakout.
Key Scenarios for What Happens Next
Bearish Scenario for Monero XMR
If downward pressure continues, the first strong support zone falls between 350 and 360. A move into this region would not necessarily break the overall bullish structure, but a decisive daily close below it could weaken the chart considerably. In that case, the next significant supports lie near 320 and, more distantly, 233. Traders keeping an eye on lower-risk entry points may watch these areas closely.
Bullish Scenario for Monero XMR
If market sentiment improves and Bitcoin stabilizes, Monero XMR may attempt another push toward the 440 resistance. Breaking above that level with conviction could trigger a wave of liquidations on short positions, sending the coin toward the 518 region. Weekly indicators support this possibility, as capital inflows and positive momentum align with the potential for a larger bullish continuation.
Why Monero XMR Remains Important to Watch
Monero XMR stands out because it has held stronger than other privacy-related coins in the current environment. Its steady performance, combined with bullish weekly indicators, creates interest among traders who prefer assets with stronger underlying resilience. The short-term situation remains uncertain, but the medium-term trend retains potential as long as support levels hold.
Whether Monero XMR dips toward 360 or rallies back toward 440, the coming price movements will reveal the next stage of its trend. Traders should watch liquidity zones, long and short liquidation clusters, and Bitcoin’s broader market direction to gauge how conditions might shift.
Keep yourself updated with the latest crypto news with FYI Gazette
Read more about Memecoins with FYI Gazette
Keep yourself updated with the latest Altcoin News with FYI Gazette
 Bitcoin
  Ethereum
  Tether
  XRP
XRP  BNB
BNB  Solana
  Dogecoin
  Litecoin
  Pepe
Pepe