
Shiba Inu Whale Transfers Surge as Momentum Builds
Shiba Inu has drawn overwhelming market attention after registering one of its largest waves of whale transactions in months. This Shiba Inu surge reflected a clear shift in behavior among major holders, signaling that larger participants may be repositioning as volatility compresses and the market waits for a decisive breakout. With hundreds of high-value transfers and a substantial net increase of tokens moving onto exchanges, traders began reassessing the underlying structure guiding SHIB’s short-term direction. The recent spike, while potentially unsettling at first glance, has ultimately reinforced several important signals that shape the current narrative.
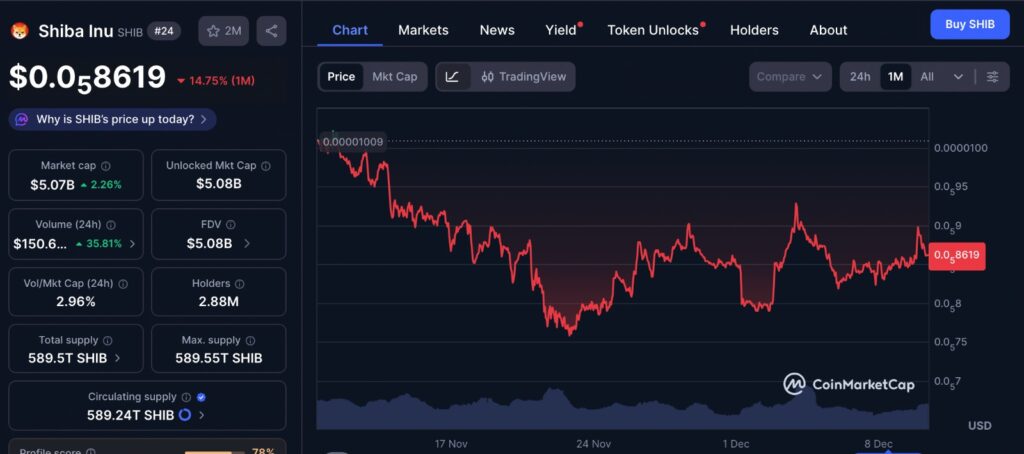
The latest one-month price chart for Shiba Inu highlights how the asset has reacted to recent market shifts, including whale activity and rising buy-side pressure. After moving within a relatively tight range for most of the month, SHIB showed brief surges in volatility that aligned with structural support levels identified in technical analysis. The chart also reflects how buyers consistently stepped in near key demand zones, helping price stabilize despite broader market fluctuations. This one-month snapshot reinforces the idea that SHIB’s recent momentum is forming on top of a steady base rather than sudden speculative swings. If buyers continue defending these levels, the chart setup may strengthen the broader bullish narrative.
Shiba Inu whale activity shows strongest spike since early June
Shiba Inu recorded 406 whale transfers above one hundred thousand dollars and a net increase of more than one trillion tokens on exchanges. For many assets, such inflows would trigger immediate concern about sell pressure overwhelming the market, but SHIB’s price structure did not reflect panic. Instead, the chart continued respecting major structural zones, suggesting these movements were more about repositioning than unloading. Whale activity often becomes a directional cue during low-volatility environments, and SHIB is operating within such a phase now. Although price action remained constrained, the consistency of behavior among large holders allowed traders to assess demand with greater clarity.
Even so, the price still required confirmation above the retest zone for a stronger directional shift. The market recognized that while the metrics showed strength, confirmation from price behavior remained the final trigger before a clearer trend could emerge.
Shiba Inu breakout retest marks a decisive turning point
Shiba Inu broke out of its falling wedge and retested the upper boundary of the pattern, a step that often defines whether momentum can extend. The falling wedge structure had developed over weeks of compression, and the breakout represented a potential shift in directional bias. The retest, however, became even more important, as it would indicate whether buyers were willing to defend the reclaimed level.
Price repeatedly reacted near the crucial level around 0.00000883, reinforcing its importance. Historically, such patterns hold when buyers protect the boundary cleanly and consistently. In SHIB’s case, early reactions suggested that buyers were indeed stepping in, though the follow-through remained dependent on maintaining control of this zone. The MACD on the daily timeframe tilted upward, and the histogram moved away from earlier flattening, supporting the idea of momentum gradually turning in favor of buyers.
Even with these signals, SHIB traded in a tight range, indicating that continuation was possible only if buyers maintained strength at the retest level.
Shiba Inu CVD highlights persistent buy-side absorption
Another pillar supporting the structure came from SHIB’s taker buy cumulative volume delta. Over the past ninety days, CVD maintained strong buyer dominance. Each time price dipped, buyers stepped in aggressively, preventing deeper downside and creating a short-term base beneath intraday fluctuations. Such behavior often appears during accumulation phases, especially when whales are active in the background.
The consistency between whale transfers and positive CVD readings suggested that traders with significant size were gradually scaling into positions rather than exiting them. While price movement remained controlled, CVD continued leaning directionally toward the upside, reinforcing a constructive interpretation. For many analysts, buyer persistence became one of the most dependable indicators within SHIB’s current structure as volatility began building again.
Shiba Inu burn rate spikes sharply as supply pressure eases
Another key development came from SHIB’s burn rate, which surged by more than one thousand percent over twenty-four hours. This sudden increase resulted in a meaningful drop in circulating supply. Although token burns do not automatically generate upward price movement, such abrupt supply reductions often support bullish structures during periods of growing demand. The timing also aligned well, as the burn spike arrived while SHIB was forming a favorable technical pattern and while whales exhibited increased activity.
When burn rates rise in conjunction with whale involvement and strong CVD behavior, the narrative of tightening supply becomes more compelling. While long-term impact depends on the sustainability of broader market trends, supply reduction can improve short-term responsiveness and reduce the amount of pressure needed for upward moves. With buyers defending structural regions, this supply-side shift provided additional confidence to bullish participants.
Funding rates flip positive as derivatives show renewed confidence
Derivatives data added yet another layer to the evolving setup. Funding rates turned positive, signaling that long traders gained stronger conviction. Where earlier hesitation had been visible, traders were now aligning with the idea that SHIB could extend its move if conditions held. The OI-weighted funding rate also climbed as Shiba Inu maintained structure above the breakout level.
A look at the liquidation heatmap revealed clusters near 0.0000084 and 0.00000886. Such areas often become magnets for volatility as the market seeks liquidity. While positive funding sometimes introduces risk of overextension, the current alignment showed a healthy balance between spot and derivatives sentiment, indicating that traders were not simply chasing upside blindly but were responding to legitimate structural shifts.
Combined signals give Shiba Inu a supportive setup
Taken together, Shiba Inu now exhibits one of the most supportive combinations of signals seen in recent weeks. Strong whale activity, a validated breakout retest, sustained buy-side CVD, a substantial burn-rate spike, and improved derivatives sentiment all point toward constructive momentum. These conditions do not guarantee immediate continuation, but they provide a far more favorable environment than previous weeks.
The key remains whether buyers continue defending the retest area. If they do, momentum could extend in the near term. If the level fails, the structure weakens despite otherwise strong metrics.
Final Thoughts
Shiba Inu now displays several positive structural elements even as traders remain watchful for confirmation. The market appears steadier, the underlying flows strengthen the bullish case, and sentiment leans supportive. If buyers maintain control of the retest zone, the current setup may hold and provide room for further momentum.
Keep yourself updated with the latest crypto news with FYI Gazette
Read more about Memecoins with FYI Gazette
Keep yourself updated with the latest Altcoin News with FYI Gazette
 Bitcoin
  Ethereum
  Tether
  XRP
XRP  BNB
BNB  Solana
  Dogecoin
  Litecoin
  Pepe
Pepe