
XRP Price Fractal Mirrors 2017 Rally Setup
XRP Price Fractal patterns on the weekly chart are beginning to resemble a structure that previously marked a major cycle bottom before a powerful rally. Analysts studying long term market behavior say the current setup shares similarities with the conditions that preceded XRP’s explosive move during the 2017 bull run. While the resemblance has caught the attention of traders, key resistance levels must still be broken before any sustained bullish momentum can be confirmed.
Recent chart comparisons suggest that XRP’s sharp correction from its multi year highs may be forming a structure similar to the one that appeared before the historic rally several years ago. However, analysts emphasize that technical confirmation is still required before the pattern can be validated.
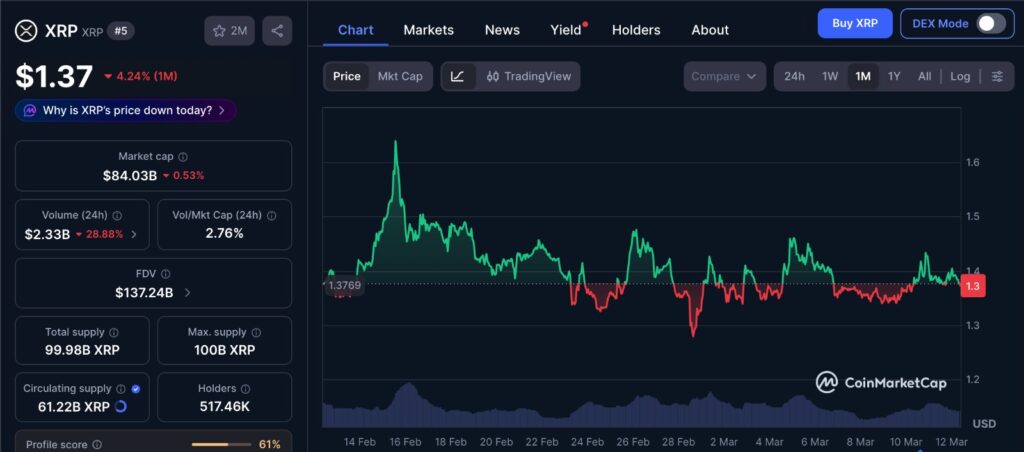
XRP’s recent price action over the past month highlights a market that has been consolidating after a sharp correction earlier in the cycle. The chart shows repeated attempts to stabilize as buyers and sellers test key levels, reflecting a period where market participants appear to be reassessing value rather than driving a strong directional move. Such phases often emerge after large swings, when leverage resets and liquidity gradually rebuilds across the market. As a result, the recent one-month structure may be less about immediate momentum and more about how traders position themselves around nearby resistance and support zones.
XRP Price Fractal resembles the 2017 cycle structure
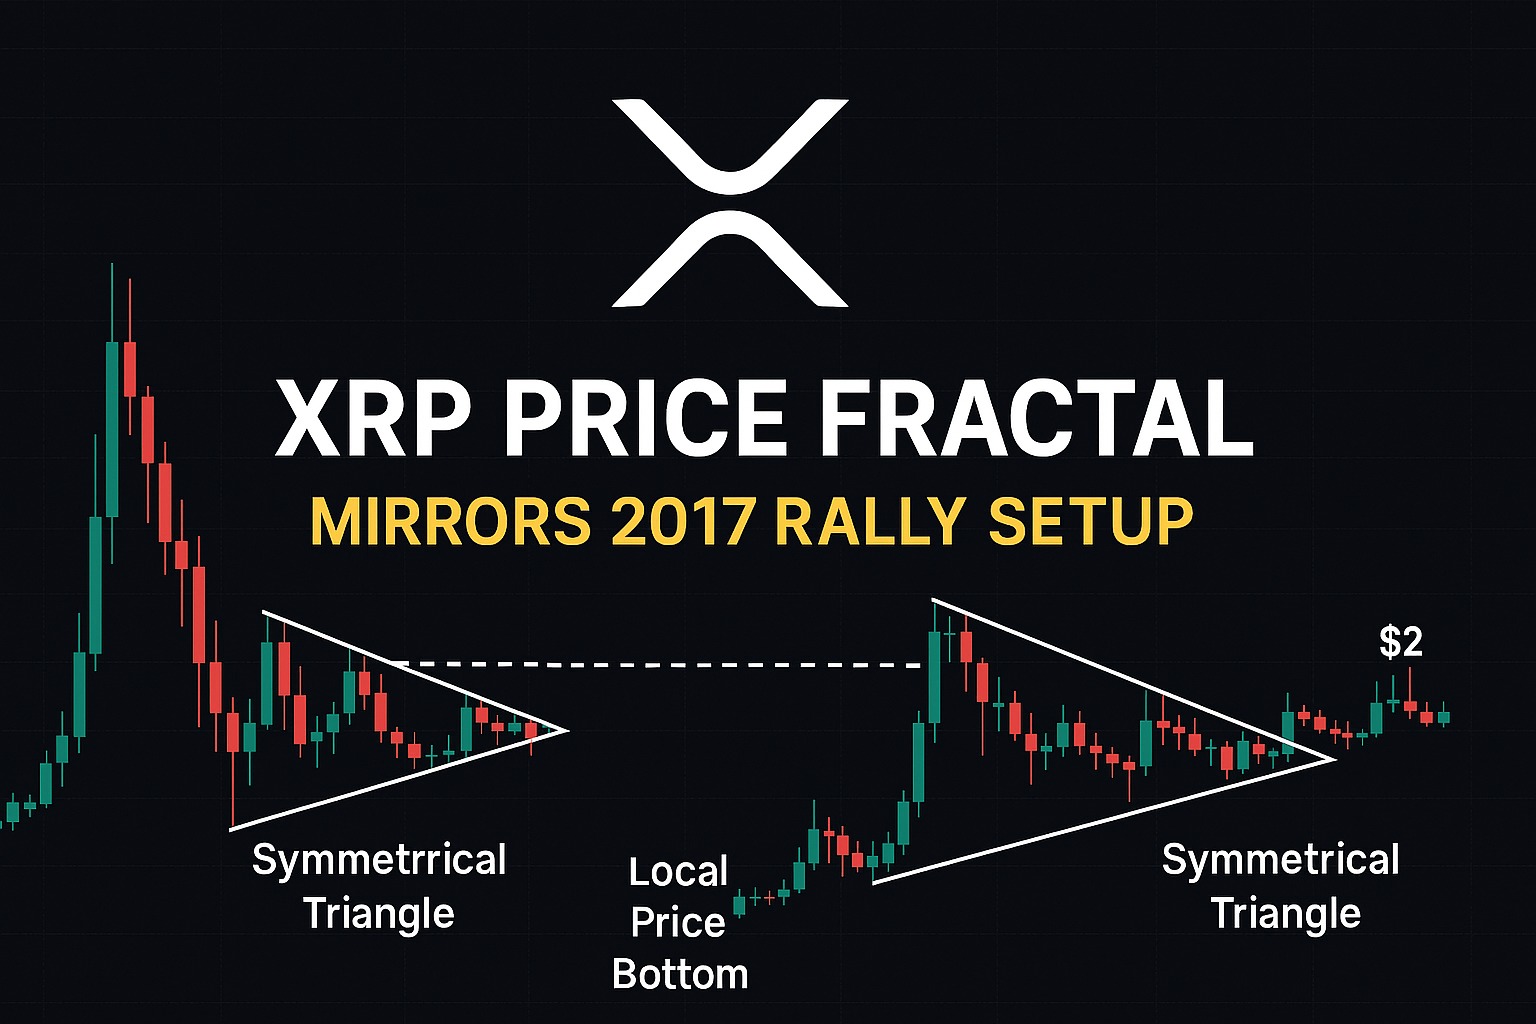
A long term fractal comparison between the 2017 to 2018 cycle and the current 2024 to 2026 cycle highlights several similarities on XRP’s weekly chart.
During the earlier market cycle, XRP formed a symmetrical triangle pattern following a period of consolidation. This pattern developed after the asset experienced a sharp decline, which eventually marked a local price bottom before the market reversed direction.
In the present cycle, XRP’s drop from multi year highs near 3.66 dollars to around 1.10 dollars appears to resemble a retest of the lower boundary of a symmetrical triangle formation.
In the 2017 market structure, XRP declined to approximately 0.12 dollars during the consolidation phase. That drop represented the final test of the triangle’s lower trendline before momentum shifted and the market moved higher.
The similarity between these formations has drawn attention from technical analysts who often study historical price patterns to understand possible market behavior.
XRP Price Fractal sparks discussion among analysts
Several market observers have pointed to this fractal pattern as a potential signal that XRP may be forming a long term structure similar to the previous cycle. Crypto analyst Javon noted that the chart structure suggests a scenario where the broader move could unfold in a comparable way.
According to the analyst, the current decline may represent only a temporary pullback within a larger trend structure. If the pattern continues to develop in a similar manner to the earlier formation, XRP could eventually move into a stronger upward phase.
During the previous cycle, XRP spent an extended period consolidating inside the triangle pattern while market leverage conditions gradually reset. Once the price broke above the triangle’s upper boundary, momentum accelerated quickly.
That breakout eventually triggered a powerful rally that pushed XRP up by more than 1,500 percent within a relatively short period.
Although the fractal comparison has created interest among traders, analysts caution that historical chart patterns do not guarantee identical outcomes in future market cycles.
$2 resistance remains the key breakout level
Despite the structural similarities between the two cycles, XRP must overcome a major resistance zone before any bullish continuation can be confirmed.
Technical analysis suggests that the region between 1.78 dollars and 2.30 dollars represents a critical barrier that buyers must break to sustain upward momentum.
This zone is significant because several major technical indicators converge near the 2 dollar level. These include the upper boundary of the triangle formation, the 100 week simple moving average, and the 50 day simple moving average.
The convergence of these indicators creates a strong resistance area that could prevent price from advancing further unless strong buying pressure emerges.
Data tracking realized price distribution also shows large supply clusters above the current market price. Approximately 3.6 percent of the XRP supply is concentrated around the 2 dollar level, while another 3.15 percent sits near 1.80 dollars.
These supply clusters represent price levels where many investors previously accumulated XRP, which can lead to increased selling pressure when the market approaches those levels.
For this reason, a sustained breakout above the resistance zone would likely be necessary to confirm a long term bullish shift.
XRP Price Fractal faces descending channel resistance
Additional technical analysis shows that XRP must also break above the downtrend line of a descending channel pattern that has formed on the daily chart.
This downtrend line currently aligns near the 2 dollar region, reinforcing the importance of that level as a major technical barrier.
A breakout above this descending channel could indicate that bearish momentum is weakening and that a broader trend change may be developing.
However, failure to break above this resistance could result in continued consolidation or further downward pressure in the short term.
Exchange balances suggest XRP accumulation
While price action remains constrained by resistance levels, on chain metrics provide another perspective on investor behavior.
Data tracking XRP transfer activity across multiple exchanges shows that the number of daily depositing and withdrawing transactions has dropped to extremely low levels.
When this metric declines, it often suggests that investors are withdrawing XRP from exchanges and transferring it into external wallets.
This behavior is commonly interpreted as a sign of accumulation, since investors typically move assets to private wallets when they intend to hold them for longer periods rather than actively trade them.
Analysts have also observed sudden spikes in withdrawal activity from major exchanges. One such spike recorded more than fourteen thousand withdrawal transactions within a single day.
These movements suggest that some investors may be accumulating XRP and moving their holdings away from trading platforms.
Editor’s View: Why fractal patterns influence market sentiment
Fractal comparisons tend to gain attention not because traders expect history to repeat exactly, but because they reflect how market participants respond to familiar structures. When investors see a pattern that resembles a previous cycle low, it often shifts focus toward key levels where sentiment previously changed. In XRP’s case, the resemblance to the 2017 setup may partly explain why the $2 region is receiving such close scrutiny. The chart alone does not determine outcomes, but it often shapes how traders interpret risk and positioning during periods of consolidation.
XRP supply on exchanges continues to decline
Supporting this accumulation narrative, the total balance of XRP held on exchanges has continued to trend lower.
Exchange reserves have fallen to approximately 12.9 billion XRP, a level last seen in May 2021. Declining exchange balances typically indicate that fewer tokens are immediately available for trading, which can gradually reduce selling pressure.
Institutional developments have also attracted attention. Outflows from US based spot XRP exchange funds have slowed after a major financial institution emerged as the largest ETF holder.
This shift suggests that some institutional investors may still hold long term confidence in XRP despite recent volatility.
Taken together, the XRP price fractal pattern, the strong resistance near 2 dollars, and the declining exchange balances place the market at an important technical crossroads. Whether the current structure develops into a breakout similar to the 2017 rally will depend largely on XRP’s ability to overcome resistance while maintaining broader market support.
Disclaimer: This content is for informational purposes only and does not constitute financial advice.
Keep yourself updated with the latest crypto news with FYI Gazette
Read more about Memecoins with FYI Gazette
Keep yourself updated with the latest Altcoin News with FYI Gazette
 Bitcoin
  Ethereum
  Tether
  BNB
BNB  XRP
XRP  Solana
  Dogecoin
  Litecoin
  Pepe
Pepe