
Bitcoin Trend Line Battle Raises $60K Risk
Bitcoin Trend Line pressure intensified ahead of the weekly close as traders focused on a crucial technical level that could influence Bitcoin’s next market direction. The cryptocurrency spent the weekend trading below an important long term indicator, raising concerns that the market may confirm fresh resistance if bulls fail to reclaim the level soon.
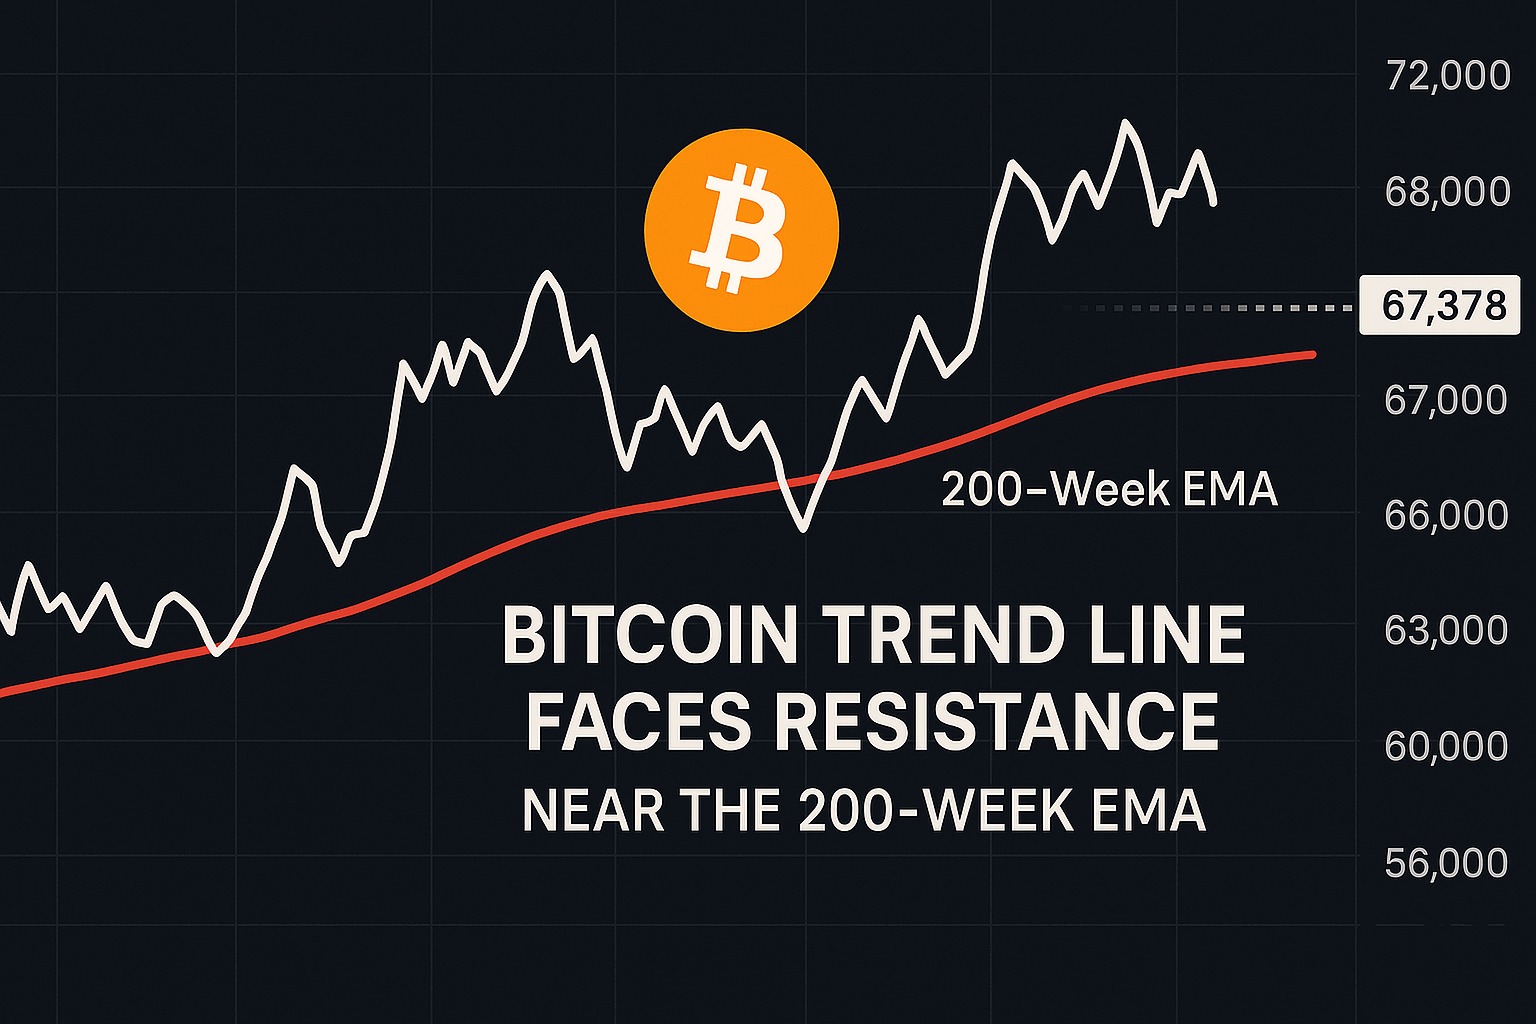
Bitcoin was trading near $67,378 at the time of analysis, while price action continued to struggle beneath a trend line that has historically played a major role in defining Bitcoin’s broader market structure. Traders are closely monitoring this level because repeated failures to reclaim it could weaken bullish momentum and increase the likelihood of further downside pressure.
Data from TradingView showed that BTC/USD dropped to multiday lows of $66,569 during the weekend. The move pushed Bitcoin further away from the key exponential moving average that traders have repeatedly attempted to reclaim over recent sessions.
Each time the price has moved above the level, the breakout has quickly failed. This pattern has kept market participants cautious and has raised questions about whether the recent rebound has already lost strength.
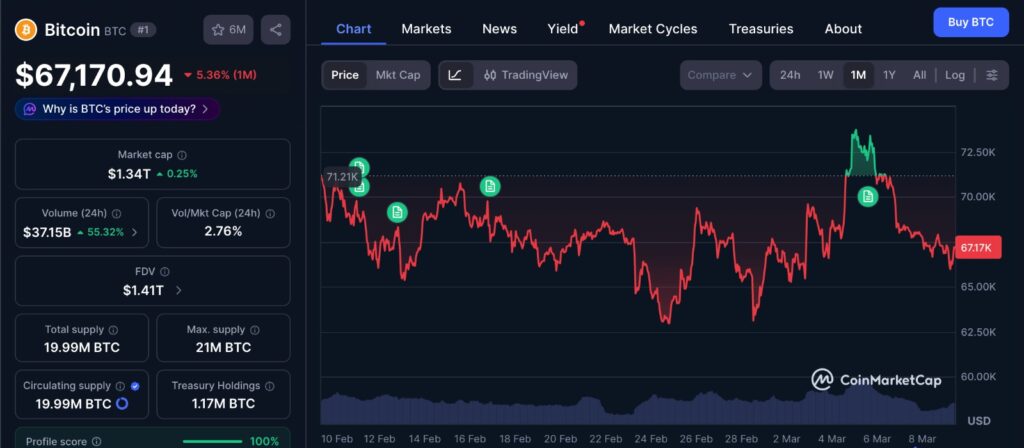
The one month price chart highlights how Bitcoin has struggled to regain sustained momentum despite several short term rebounds. While the broader trend remains relatively stable, the chart shows repeated attempts to move higher being met with resistance near key technical levels. This type of price behavior often reflects a market that is still searching for direction, with traders reacting to both macro signals and major technical indicators. As a result, the chart illustrates a period of consolidation rather than a clear trend shift, reinforcing why the current battle around the long term trend line is receiving so much attention.
Bitcoin Trend Line Faces Resistance Near the 200 Week EMA
The most important level currently being watched by traders is the 200 week exponential moving average. This long term trend line currently sits near $68,310 and has historically acted as a critical boundary between bullish and bearish market conditions.
Bitcoin recently attempted to push above the 200 week EMA but was unable to hold the breakout. The failure to maintain price above this level has placed renewed attention on the upcoming weekly candle close.
Market analyst Rekt Capital highlighted that Bitcoin had once again produced an upside wick beyond the moving average before losing momentum. This type of price action often signals that buyers attempted to push the market higher but were quickly met with selling pressure.
According to his analysis, a weekly close below the 200 week EMA would continue reinforcing the level as resistance. If that happens, the trend line could become a barrier that limits Bitcoin’s ability to recover in the near term.
Historically, this indicator has carried major significance for Bitcoin’s long term market cycles. When the asset trades above the 200 week EMA, it typically reflects stronger bullish sentiment. When the price falls below it, however, the same level often becomes a ceiling that prevents further rallies.
For this reason, the market’s reaction around this trend line is being watched closely.
Bitcoin Trend Line Compared With the 2023 Market Structure
The chart shared by trader Merlijn highlights the structural comparison many analysts are watching closely. In his view, Bitcoin appears to be revisiting a similar setup to the one seen in 2023, when the 200 EMA acted as the foundation for a broader rally after being reclaimed and retested. The current price area near the mid $60,000 range sits close to that same structural region, which is why traders continue monitoring whether the level holds or fails. Observations like this often influence how market participants interpret trend line behavior, especially when long term indicators begin to shape broader sentiment.
Despite the technical pressure surrounding the 200 week EMA, some traders believe the current structure could still follow patterns seen in previous market cycles.
Trader Merlijn pointed to similarities between the present price action and Bitcoin’s structure during 2023. During that period, Bitcoin also temporarily lost the 200 week EMA before eventually reclaiming it and continuing higher.
The process involved Bitcoin first dropping below the key trend line before returning to reclaim the level. After that reclaim, the market revisited the level once more to confirm it as support before continuing its upward momentum.
This sequence eventually helped fuel a strong rally later in the cycle.
Supporters of this comparison believe that the current price movement could represent a similar retest phase rather than a complete breakdown of market structure.
However, the outcome remains uncertain. If Bitcoin cannot reclaim the trend line soon, the level may continue acting as resistance.
Because of this uncertainty, traders are paying close attention to how the market behaves around the weekly close.
Oil and Gold Become Key Bitcoin Trend Line Catalysts
While technical indicators are playing a major role in current market analysis, macroeconomic conditions are also influencing trader sentiment.
Geopolitical tensions linked to the ongoing conflict in the Middle East have drawn attention to commodities such as oil and gold. These assets are often viewed as safe havens during periods of global uncertainty.
As a result, movements in these markets may influence broader financial sentiment, including activity in the cryptocurrency sector.
Crypto trader and analyst Michaël van de Poppe suggested that the performance of oil, gold, and silver could directly affect Bitcoin’s next move.
He emphasized that traders should closely watch these markets as the traditional financial trading week begins.
If commodities begin moving in a direction that favors risk assets, Bitcoin could potentially recover and revisit recent highs.
However, if capital continues flowing into commodities as safe havens, Bitcoin may face additional downside pressure.
Van de Poppe also explained that he would consider buying Bitcoin if prices revisit the $60,000 region. This suggests that some traders view that level as an area where demand could increase if the market weakens further.
Bitcoin Versus Gold Valuation Signals
Another metric drawing attention among traders is Bitcoin’s valuation compared with gold.
Van de Poppe highlighted that the relative strength index for Bitcoin when compared against gold has reached extremely low levels. In fact, the reading represents the lowest level ever recorded for that specific metric.
This suggests that Bitcoin may currently be undervalued relative to the precious metal.
At the same time, the data may indicate that gold itself is trading at elevated levels in the short term.
Cross asset comparisons such as this are often used by traders to evaluate where capital may move next.
If investors begin rotating capital away from commodities and back into digital assets, Bitcoin could benefit from renewed demand.
Editor’s View: Why Traders Keep Returning to the Same Trend Line
Long term indicators like the 200 week EMA often attract attention not only because of their technical value, but because many participants are watching the same level at the same time. When Bitcoin repeatedly fails to reclaim such a level, it can quietly influence trader behavior, encouraging caution even among those who remain structurally bullish. In these moments, price action often reflects hesitation rather than clear directional conviction. The market can spend extended periods testing the same boundary as participants reassess risk, liquidity, and macro signals before committing to a stronger move.
Why the Bitcoin Trend Line Matters for Market Direction
Technical indicators like the 200 week EMA are important not only because of their mathematical calculation but also because of the psychology surrounding them.
Large numbers of traders, institutions, and algorithmic trading systems monitor the same levels. When price approaches these indicators, trading activity often increases significantly.
For Bitcoin, the ongoing battle around the trend line reflects a broader test of market confidence.
If buyers manage to reclaim the level and turn it back into support, the market could regain upward momentum.
If the level continues to act as resistance, however, Bitcoin may remain under pressure in the near term.
With the cryptocurrency hovering near a crucial technical boundary, traders are watching the weekly close closely to determine whether the trend line becomes a ceiling for price or a foundation for the next move.
Disclaimer: This content is for informational purposes only and does not constitute financial advice.
Keep yourself updated with the latest crypto news with FYI Gazette
Read more about Memecoins with FYI Gazette
Keep yourself updated with the latest Altcoin News with FYI Gazette
 Bitcoin
  Ethereum
  Tether
  BNB
BNB  XRP
XRP  Solana
  TRON
TRON  Dogecoin
  Litecoin
  Pepe
Pepe