
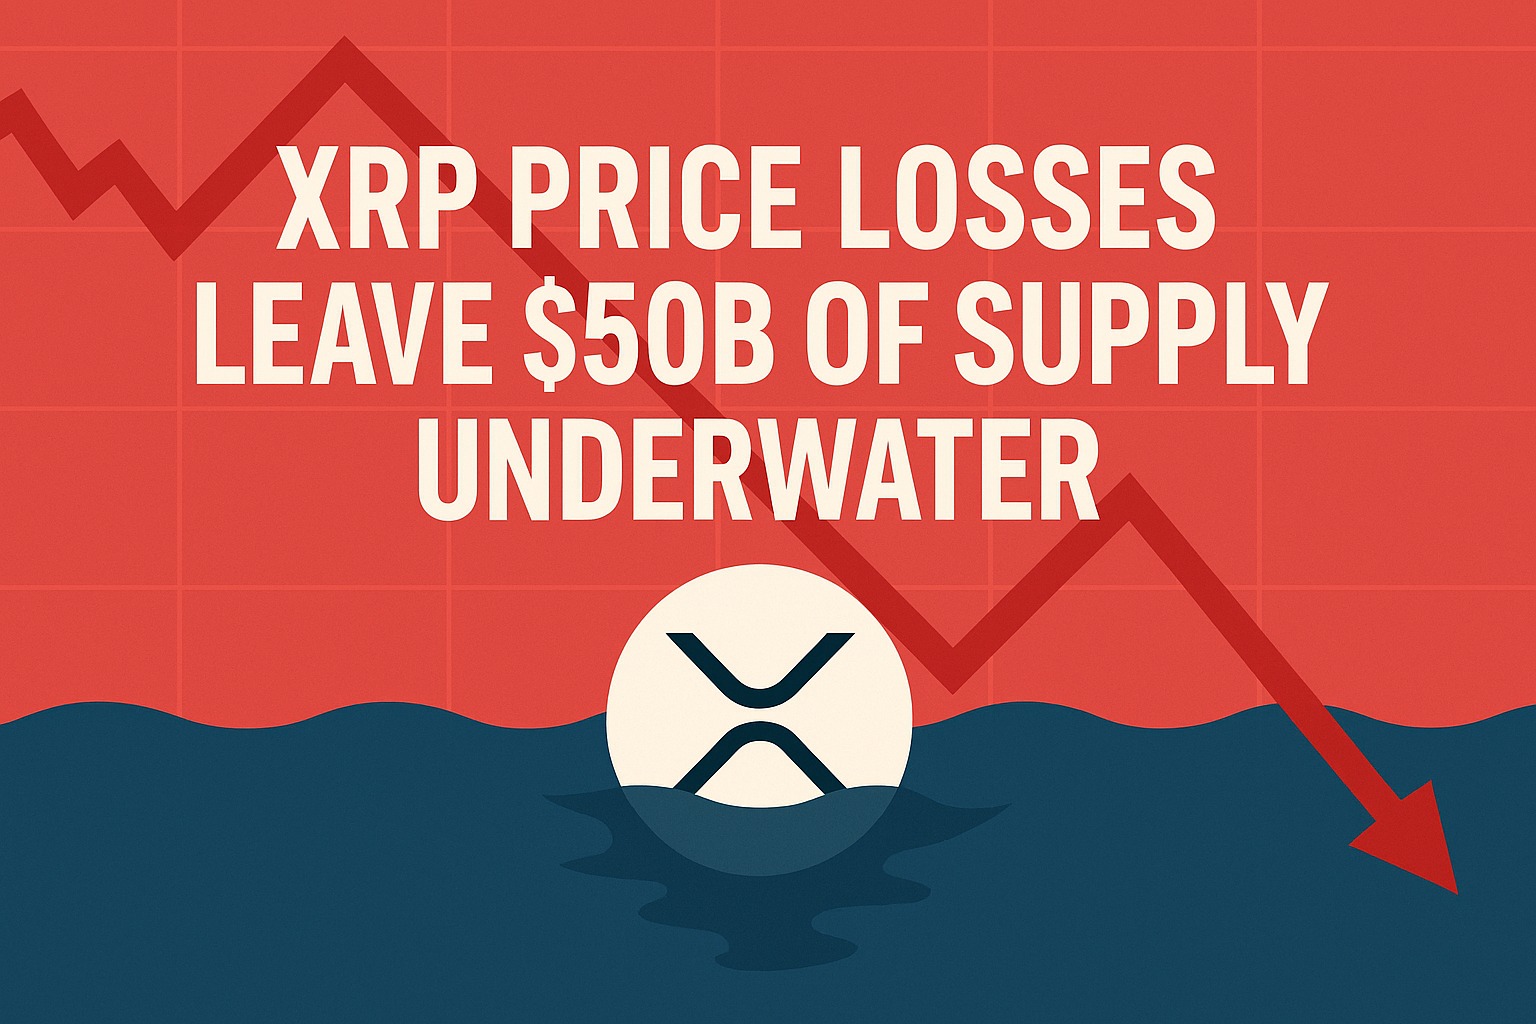
XRP Price Losses Leave $50B of Supply Underwater
XRP Price Losses are increasing as the cryptocurrency trades well below its previous highs, leaving a large portion of investors holding underwater positions. XRP traded around $1.35 on Monday, representing a steep 63 percent decline from its multiyear high of $3.66 reached in July 2025. The drop highlights the risks that emerge during extended crypto market downturns, where many investors who bought during bullish periods are left with significant unrealized losses.
The scale of the decline has pushed a majority of XRP’s circulating supply into the red, reflecting the broader impact of the market correction on holders across different time horizons.
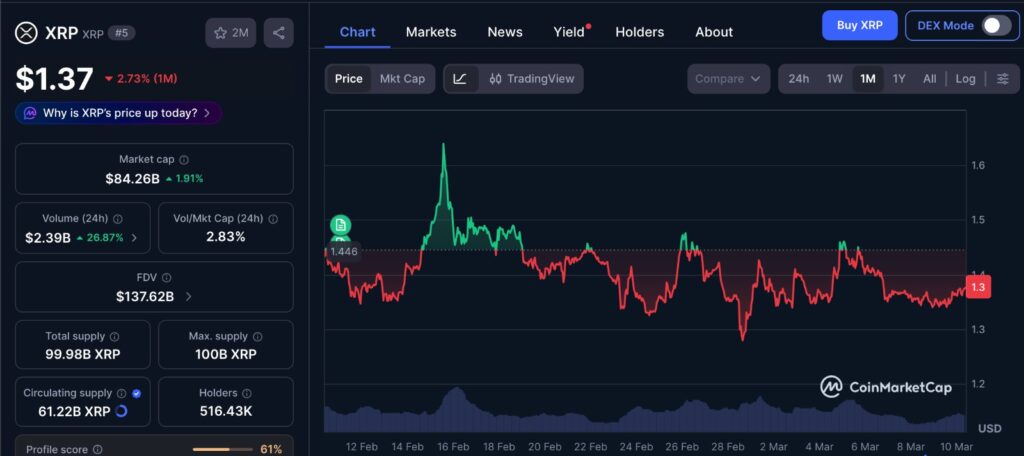
The chart below shows XRP’s price movement over the past month, highlighting the steady decline that has pushed the asset below key psychological and technical levels. Over this period, XRP has struggled to regain upward momentum, with rallies repeatedly facing resistance as market sentiment remained cautious. The one month trend also reflects the broader pressure on holders, as prices continue to trade below the average cost basis for many investors. This context helps explain why a large portion of XRP’s circulating supply has moved into unrealized loss territory.
XRP Price Losses Leave Majority of Supply Underwater
The recent downturn has placed significant pressure on the XRP market. The XRP/USD pair is currently trading about 28 percent below its yearly opening price of $1.87, extending a broader period of weakness after the asset closed 2025 down 11.6 percent.
This extended drawdown has pushed a large portion of XRP’s supply into unrealized loss territory. With the token trading near $1.35, approximately 36.8 billion XRP are currently held at a loss.
These holdings represent roughly $50.8 billion in unrealized losses. In terms of supply distribution, this means that more than 60 percent of XRP’s circulating supply is now underwater.
When such a large percentage of supply is held at a loss, it often reflects how quickly sentiment can shift after a strong rally. During bullish periods, many investors enter the market at elevated price levels. When prices later correct sharply, those positions can remain unprofitable until the market recovers.
XRP Price Losses Deepen Below Holder Cost Basis
Another indicator highlighting the pressure on investors is XRP’s aggregate holder cost basis. Current data suggests that the average acquisition price across the network sits around $1.44.
Because the current market price of approximately $1.35 sits below that level, many long term holders are now holding positions below their average entry price.
This situation often creates a more cautious market environment. Investors who find themselves underwater may either wait for a recovery before selling or reduce their exposure to limit further downside risk.
The broader context also shows that XRP has struggled to maintain the momentum seen earlier in the cycle when prices surged toward the $3.66 peak in mid 2025.
XRP Price Losses Extend Into Institutional Markets
The impact of XRP’s decline is not limited to retail holders. Institutional investment products tied to XRP are also seeing shifts in investor behavior.
Spot XRP exchange traded fund investors have been reducing their exposure in recent days. These products recorded two consecutive days of outflows totaling $22.8 million.
The largest redemption occurred on Friday, when approximately $16.2 million exited these funds. This represented the largest single day withdrawal since Jan. 29, when these products recorded $93 million in outflows.
Beyond ETFs, global XRP investment products have also experienced declining demand. During the week ending March 6, these products registered more than $30 million in net outflows, indicating a broader risk off sentiment across institutional markets.
XRP Price Losses and Key Levels Below $1.40
Technical analysts are closely watching several price levels that may influence XRP’s short term structure. The market is currently trading within a defined range where $1.40 acts as resistance and $1.30 functions as a critical support level.
At the moment, XRP is retesting the lower boundary of this range. Analysts note that if buyers defend the current support zone, the price could rotate back toward the upper boundary of the range.
However, if the support fails, the broader range structure may shift and open the possibility for further downside movement.
Support Zones Under Pressure
One important area sits between $1.30 and the local low of $1.27 recorded on Feb. 28. If the market loses this level, the next potential support could appear near $1.13.
This level coincides with the 200 week exponential moving average, which many traders use as a long term trend indicator. When prices approach this type of technical level, market participants often watch closely to see whether buying demand increases.
A failure to hold this zone could signal that the market is searching for deeper support after the recent decline.
Resistance Levels That Could Shift Momentum
On the upside, traders are watching the $1.40 level closely. This area corresponds with the 200 week simple moving average, which now acts as an important resistance point.
Data from realized price distribution shows that around $1.28 billion worth of XRP was accumulated near this price, suggesting that many investors entered positions in this area.
If the market is able to reclaim this level and establish it as support, it could indicate that buying pressure is returning to the market.
Editor’s View: Why Unrealized Losses Often Shape Market Behavior
When a large portion of supply falls into unrealized losses, market behavior often becomes more cautious rather than reactive. Many holders who bought near higher price levels tend to avoid selling immediately, choosing instead to wait for prices to recover closer to their entry point. This creates a period where activity slows and liquidity thins, even if volatility remains. In markets like crypto, these phases often reflect investor psychology as much as they reflect technical levels on a chart.
Market Structure Behind XRP Price Losses
The current market structure shows how quickly investor positioning can change during a correction. When more than half of an asset’s supply is held at a loss, sentiment often becomes more cautious across the market.
Some investors may decide to reduce exposure as prices decline, while others may hold their positions in anticipation of a future recovery. These dynamics often lead to consolidation phases where the market stabilizes before establishing a clearer trend.
For XRP, the combination of declining prices, institutional outflows and a majority of supply in unrealized losses illustrates a market still adjusting after a strong rally earlier in the cycle. As traders monitor the $1.40 resistance and the $1.30 support zone, these levels may play an important role in determining the next phase of XRP’s price movement.
Disclaimer: This content is for informational purposes only and does not constitute financial advice.
Keep yourself updated with the latest crypto news with FYI Gazette
Read more about Memecoins with FYI Gazette
Keep yourself updated with the latest Altcoin News with FYI Gazette
 Bitcoin
  Ethereum
  Tether
  BNB
BNB  XRP
XRP  Solana
  TRON
TRON  Dogecoin
  Litecoin
  Pepe
Pepe