
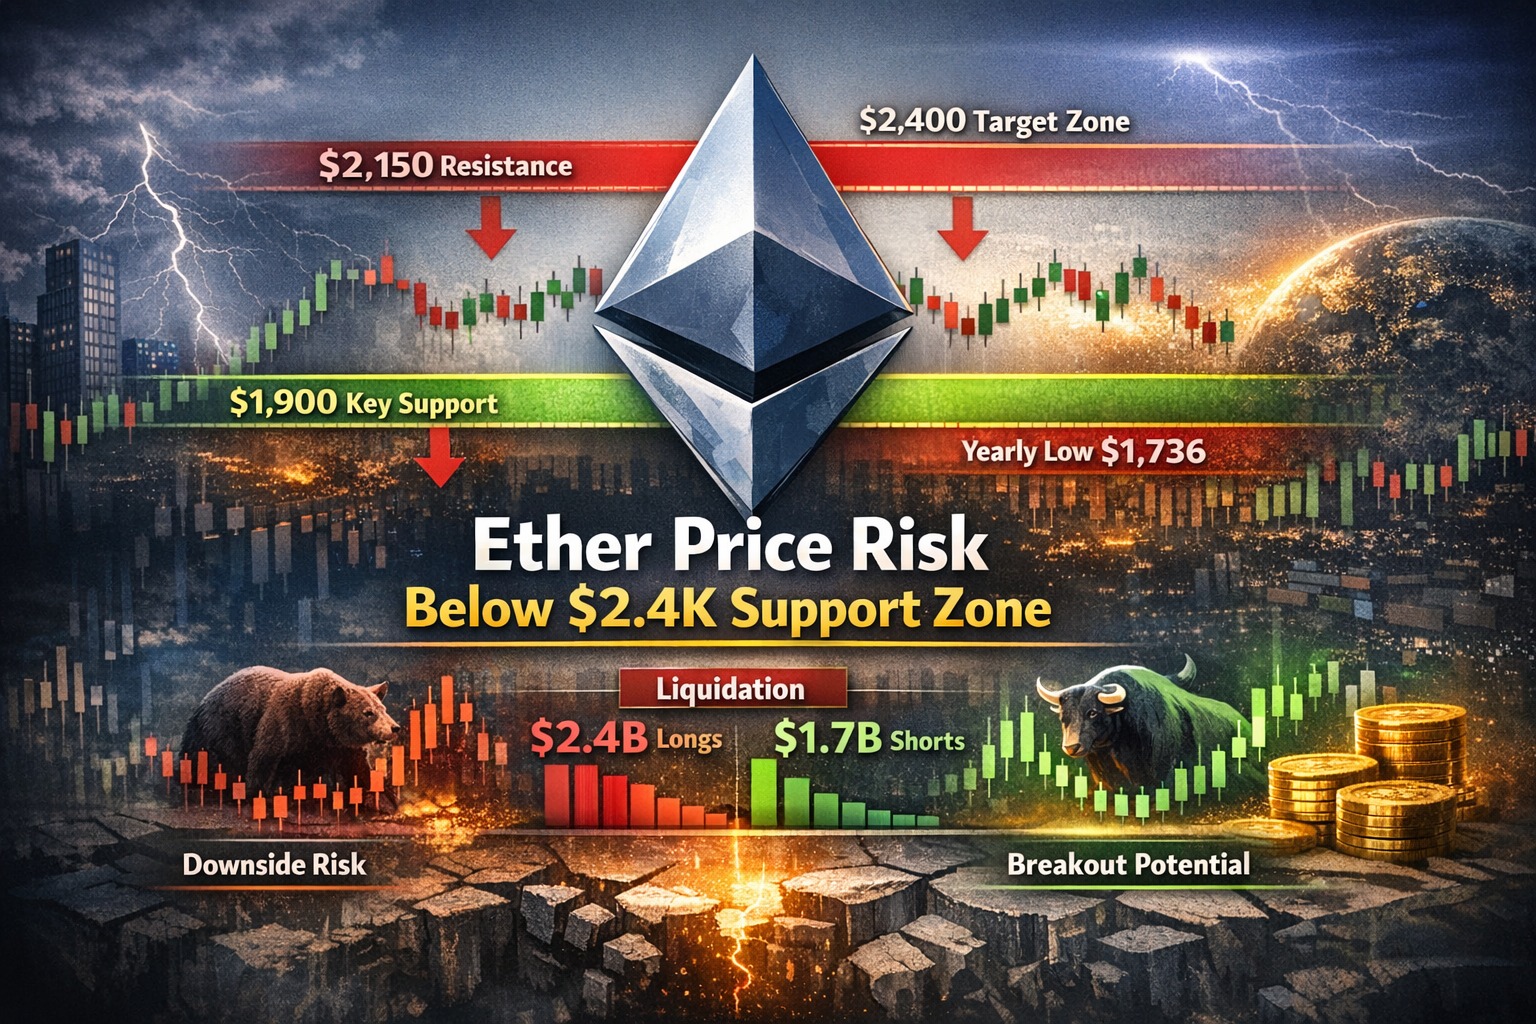
Ether Price Risk Below $2.4K Support Zone
Ether Price Risk tends to emerge not when price declines, but when repeated attempts to move higher fail to change who controls liquidity. Each rejection near a key level reinforces the idea that supply is not being depleted, only met. Over time, this conditions participants to expect failure rather than continuation, which subtly shifts how capital is deployed. What appears as sideways movement often reflects a deeper imbalance where conviction weakens before price does.
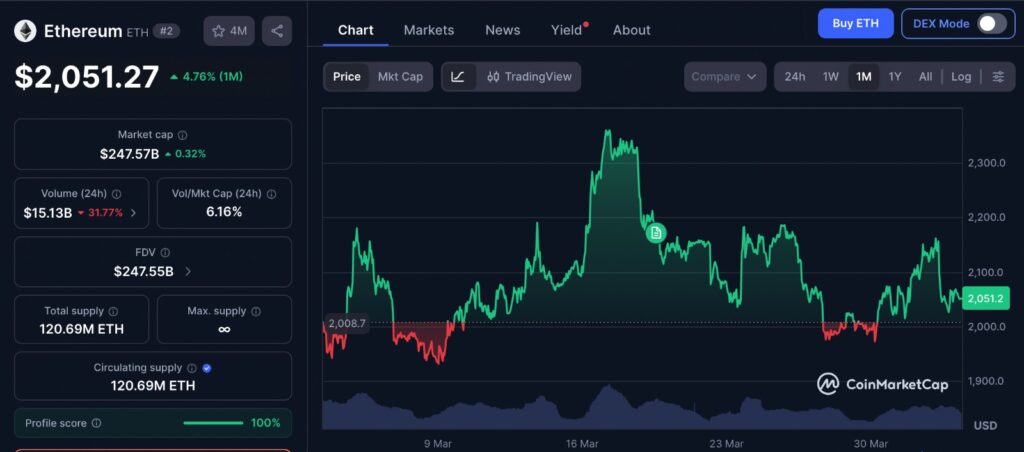
The one-month chart reflects a market that is not trending decisively, but repeatedly testing the same boundaries without establishing acceptance. Each move toward resistance shows reduced continuation, while pullbacks fail to attract strong defensive buying, indicating a lack of conviction on both sides. This type of price behavior often signals that liquidity is being built rather than resolved, with positioning accumulating around key levels. What stands out is not volatility, but the persistence of rejection, suggesting that control remains with participants managing supply rather than those attempting to push price higher.
Ether Price Risk Builds Under $2,150 Resistance
The repeated rejection near $2,150 reflects more than technical resistance. It highlights a controlled area where sell-side liquidity continues to meet incoming demand. Over the past two months, this level has capped rallies multiple times, suggesting that larger participants are comfortable distributing risk there rather than allowing price to expand higher.
The presence of higher highs and higher lows on the daily chart creates the appearance of strength, but without a break and hold above resistance, that structure remains incomplete. Strong trends convert resistance into support quickly. Here, the delay shows that upward pressure is being absorbed rather than extended.
Recent sessions show price reaching resistance with diminishing follow-through. This typically occurs when initial buying interest is met by resting liquidity that has not yet been cleared.
Ether Price Risk and the $2,400 Threshold
The $2,400 level sits above immediate resistance as a secondary test of strength. Reaching this zone would indicate that the first layer of supply has been absorbed, but the real signal lies in whether price can remain above it.
Markets move through levels in stages. The first stage is approach, the second is interaction, and the third is acceptance. Ethereum has repeatedly reached the interaction phase near $2,150 but has not transitioned into acceptance. Without that shift, any move toward $2,400 remains conditional.
If price does reach $2,400, the expectation of thinner resistance comes from reduced trading activity in that region over recent months. However, thinner liquidity does not guarantee continuation. It only reduces friction if demand is strong enough to persist.
Ether Price Risk and Downside Liquidity Zones
Below current levels, liquidity is more clearly defined. The $1,900 region contains equal lows formed earlier, which act as a concentration point for stop orders and resting demand. Markets tend to revisit such areas because they provide executable liquidity.
A break below the ascending trendline increases the probability of price moving toward this zone. Once reached, the reaction there becomes critical. If buyers fail to defend $1,900, the structure shifts from compression to expansion on the downside.
Below that, the yearly low near $1,736 represents external liquidity. This is where the market has previously found support, and where unfilled orders may still exist. Moves toward such levels are often less about sentiment and more about completing a liquidity cycle.
Ether Price Risk Seen in Liquidation Imbalance
Liquidation data reveals how positioning is distributed across the market. Approximately $2.4 billion in long liquidations sit near $1,845, while around $1.7 billion in short liquidations are clustered near $2,255.
This imbalance shows that downside movement has more potential energy. If price declines, long positions are more likely to be forced out, adding to selling pressure. At the same time, the relatively smaller short exposure indicates that the market is not aggressively positioned for further downside.
This creates an asymmetry. There is more liquidity available below price than above it, but not enough short positioning to suggest a crowded bearish trade. As a result, price can move lower without requiring strong conviction from sellers.
Ether Price Risk and Passive Selling Behavior
The absence of significant short buildup points to passive market behavior. Participants are not aggressively betting against Ethereum, but they are also not committing to buying strength.
This type of environment often produces slow directional drift rather than sharp moves. Price weakens because demand is insufficient, not because supply is overwhelming. It is a quieter form of imbalance, where control is maintained through absorption rather than aggression.
Recent sessions reflect this clearly. Ethereum remains compressed beneath $2,150, with each attempt higher failing to establish sustained acceptance above the level.
Ether Price Risk and Macro-Driven Volatility
Ethereum’s structure is also influenced by external conditions. Macroeconomic uncertainty and geopolitical developments have increased volatility across markets, which directly impacts risk assets.
A sharp increase in futures selling activity followed recent geopolitical developments, with sell volume rising significantly within a short timeframe. This type of reaction shows how quickly derivatives markets adjust to changing sentiment.
When uncertainty rises, liquidity providers tend to widen spreads or reduce exposure, making resistance levels harder to break. Ethereum’s inability to clear resistance aligns with this broader shift in risk conditions.
Ether Price Risk and Derivatives Pressure
Derivatives activity plays a central role in short-term price movement. Large sell volumes in futures markets can create immediate pressure, especially when they occur rapidly.
Despite this increase in selling, Ethereum has held near the $2,150 level. This suggests that while pressure exists, it has not yet triggered a breakdown. However, it also confirms that buyers have not regained control.
For price to move higher, spot demand must begin to absorb this derivatives-driven selling. Without that shift, futures activity continues to act as a ceiling rather than a catalyst.
Ether Price Risk Within a Range-Bound Structure
Ethereum remains within a defined range, with resistance near $2,150 and support closer to $1,900. This range is not balanced. It is constrained.
Repeated rejection at the upper boundary indicates that sellers are actively defending that level. At the same time, the absence of sharp breakdowns suggests that buyers are still present, though not dominant.
The chart reflects sequencing rather than randomness. Periods of compression correspond to phases where liquidity is positioned on both sides of price. When expansion occurs, it follows the path where liquidity is most accessible.
Ether Price Risk Moving Forward
Ethereum’s current position depends on whether it can transition from interaction to acceptance above resistance. The $2,150 to $2,400 range represents that transition zone.
If price can move above this range and hold, it would indicate that supply has been absorbed and that conditions for expansion are in place. The next area of interest would then sit near $2,800, where trading activity has been limited.
If that transition does not occur, downside liquidity remains relevant. The $1,900 level and the yearly low below it continue to act as targets within the current structure.
Editor’s View: Why Repeated Rejection Changes Behavior
When a level like $2,150 rejects price repeatedly, it starts to shape behavior beyond what the chart shows. Participants who bought earlier begin to question whether strength is actually present, while those waiting for confirmation delay entry. Over time, this creates hesitation on the buy side without requiring aggressive selling. The result is a market that looks stable on the surface but slowly loses conviction underneath.
Disclaimer: This content is for informational purposes only and does not constitute financial advice.
Keep yourself updated with the latest crypto news with FYI Gazette
Read more about Memecoins with FYI Gazette
Keep yourself updated with the latest Altcoin News with FYI Gazette
 Bitcoin
  Ethereum
  Tether
  BNB
BNB  XRP
XRP  Solana
  TRON
TRON  Dogecoin
  Litecoin
  Pepe
Pepe