
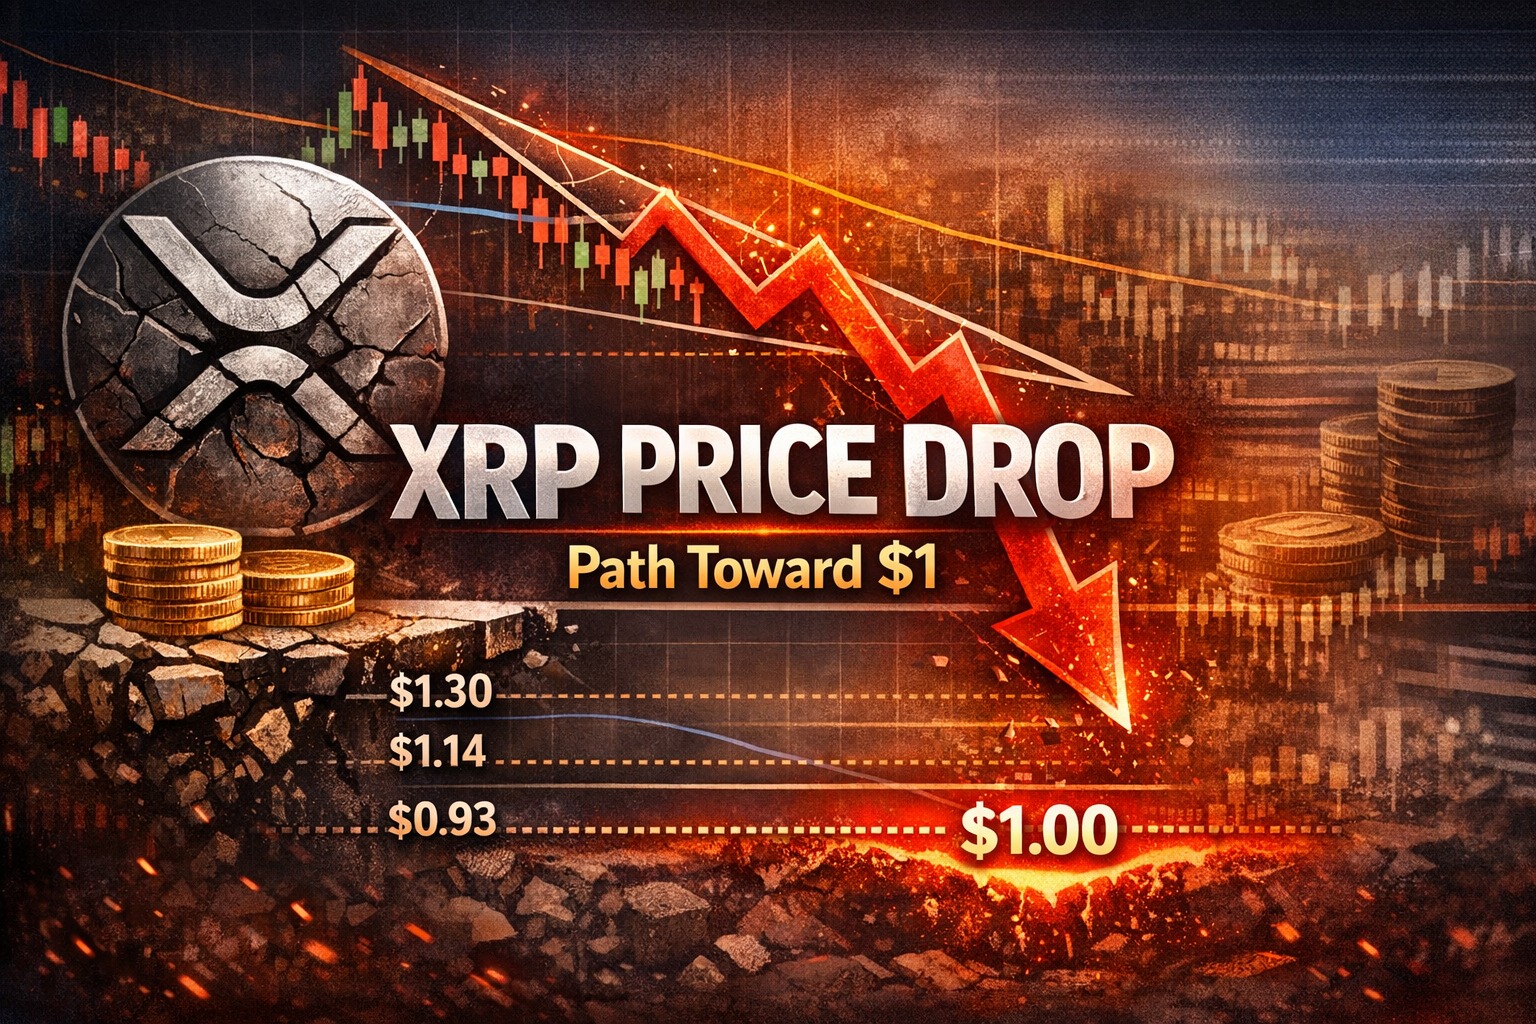
XRP Price Drop Signals Possible Move Toward $1
XRP Price Drop is not unfolding as a sudden reaction but as a controlled deterioration in market structure where demand is no longer positioned to absorb supply at higher levels. The recent rejection near resistance and repeated tests of support suggest that participation is thinning at key points rather than shifting direction abruptly. What stands out is not volatility, but the lack of urgency from buyers, which allows price to move lower without requiring aggressive selling pressure.
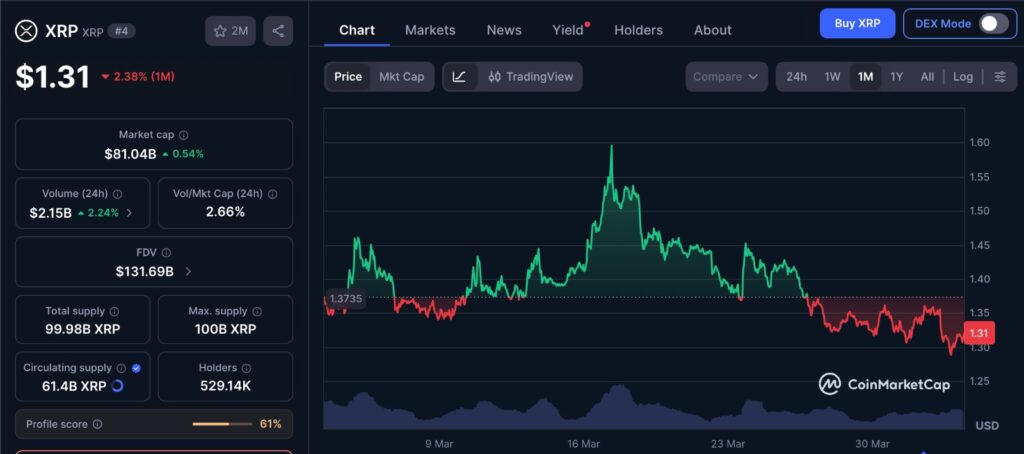
The 1-month XRP chart reflects a market that has gradually lost upward momentum rather than experiencing a sharp breakdown. Price action shows a pattern of lower highs and weak recovery attempts, indicating that buying pressure has not been strong enough to sustain moves higher. Instead of impulsive declines, the structure points to a steady shift where each bounce is met with supply, reinforcing the broader theme of fading demand and increasing ease of downward movement.
XRP Price Drop Faces Strong Resistance Near $1.40
The resistance zone between $1.40 and $1.45 is not just technically dense but behaviorally significant. This range aligns with the upper boundary of a symmetrical triangle, the 200 week exponential moving average, and the 50 day exponential moving average, creating a layered barrier where different timeframes converge.
More importantly, over 1.1 billion XRP tokens were accumulated within this range. This creates a concentration of holders whose positioning is tied to this level. When price approaches their cost basis, the decision-making shifts from accumulation to exit, particularly for participants seeking to neutralize risk rather than extend exposure.
This explains why upward moves stall in this zone. The market is not lacking interest entirely, but the available demand is being met by supply from participants looking to exit at breakeven. In such conditions, price struggles to move higher because liquidity is being absorbed before continuation can occur.
XRP Price Drop and the Symmetrical Triangle Breakdown Risk
The symmetrical triangle on the daily chart represents a compression phase where liquidity is being organized rather than resolved. Price is currently testing the lower boundary near $1.30, which acts as a structural pivot.
In theory, triangles are neutral patterns, but in practice, the direction of resolution depends on which side of liquidity weakens first. In XRP’s case, repeated rejections near resistance indicate that supply is consistently being introduced at higher levels, while demand is not expanding proportionally.
A break below $1.30 would signal that buyers at this boundary are no longer able to absorb incoming sell flow. Once this happens, the structure transitions from compression to expansion, where price moves more freely due to reduced opposition.
The next reference level in this scenario is the 200 week simple moving average near $1.14. Beyond that, the measured move of the triangle points toward $1, which reflects the full release of the compressed range.
Additional downside levels near $1.146 and $0.884 further highlight how liquidity may be distributed below current price. These levels are not arbitrary but represent areas where previous activity suggests potential rebalancing points.
XRP Price Drop and the Importance of Key Support Levels
Support levels function as zones where demand has historically been strong enough to interrupt downward movement. However, their effectiveness depends on whether that demand remains active.
The $1.27 level is currently acting as a short term threshold. Each time price returns to this level, it tests whether buyers are still willing to engage. Repeated tests gradually reduce available liquidity, as earlier buyers either exit or become less willing to re-enter.
This is why support tends to weaken over time. It is not the level itself that fails, but the participants behind it who change behavior.
On a broader scale, the $0.93 level represents the boundary of the larger bullish structure. As long as price remains above it, the higher timeframe framework remains intact. However, continued pressure from above increases the likelihood that price will eventually test this boundary as liquidity seeks a new balance.
XRP Price Drop Reflects Declining Network Activity
Onchain data provides a parallel view of this weakening structure. Daily active addresses on the XRP Ledger have declined significantly from earlier peaks in March and June 2025, now hovering around 48,000 to 50,000.
This reduction in activity reflects a change in participation rather than a temporary fluctuation. Fewer active addresses indicate that fewer users are interacting with the network, which reduces the flow of transactions that typically support price stability.
From a structural perspective, network activity acts as a proxy for engagement. When engagement declines, the market loses a layer of organic demand that would otherwise help absorb selling pressure.
XRP Price Drop and Falling Transaction Volume
Transaction data reinforces this shift. Daily transaction counts have dropped from approximately 3.4 million in March to around 1.5 million, marking a decline of about 44 percent.
This contraction indicates that fewer transfers and interactions are taking place across the network. In practical terms, this reduces the frequency at which liquidity is exchanged, making the market more sensitive to directional moves.
Lower transaction volume does not directly cause price declines, but it reduces the resilience of the market. With fewer participants active, price becomes more responsive to imbalances, allowing moves to extend further once they begin.
XRP Price Drop Signals Weakening Institutional Demand
Institutional positioning, as reflected through spot XRP exchange traded funds, also shows signs of weakening. March marked the first negative month for these ETFs since their launch, with net outflows of approximately $28 million.
Since March 26, inflows have stalled entirely, indicating that new capital is not entering at the same pace. Institutional participants typically provide steady demand, and when that demand slows, it removes a stabilizing force from the market.
Assets under management have declined from around $1.24 billion in early January to approximately $947 million. This reduction aligns with XRP’s broader price decline, suggesting that institutional exposure is being reduced alongside falling prices.
XRP Price Drop Shows a Market Adjusting to Reduced Demand
When technical structure, onchain activity, and institutional flows all weaken simultaneously, the market begins to adjust rather than react. Price is not being forced lower by a single factor, but by the absence of sufficient demand across multiple layers.
In such conditions, price movement becomes a function of where liquidity is still available. As higher levels lose support, the market naturally shifts toward areas where balance can be reestablished.
The move toward $1, in this context, reflects a continuation of this process rather than a sudden breakdown. It represents a level where prior activity suggests liquidity may once again become concentrated.
Editor’s View: Where Participation Quietly Disappears
What stands out in this structure is not aggressive selling, but the gradual withdrawal of participation. Markets rarely break down because sellers become dominant overnight. More often, they decline because fewer participants are willing to engage at higher prices, leaving gaps where price can move with minimal resistance.
This type of environment tends to feel slow and controlled, which often leads participants to underestimate the move. By the time support levels begin to fail, much of the positioning has already shifted. The visible breakdown is only the final stage of a process that has been unfolding through declining activity and reduced conviction.
Disclaimer: This content is for informational purposes only and does not constitute financial advice.
Keep yourself updated with the latest crypto news with FYI Gazette
Read more about Memecoins with FYI Gazette
Keep yourself updated with the latest Altcoin News with FYI Gazette
 Bitcoin
  Ethereum
  Tether
  BNB
BNB  XRP
XRP  Solana
  TRON
TRON  Dogecoin
  Litecoin
  Pepe
Pepe