

Pepe Price Analysis Shows Bearish Trend Risk
Pepe Price Analysis begins with a structural imbalance that is easy to overlook. Price is not declining because selling is aggressive, but because buying is not committed enough to absorb even routine pressure. This distinction matters. Markets rarely break because of force alone. They break when support quietly loses its ability to hold. PEPE’s current behavior sits in that exact phase, where stability exists on the surface, but underlying participation continues to weaken.
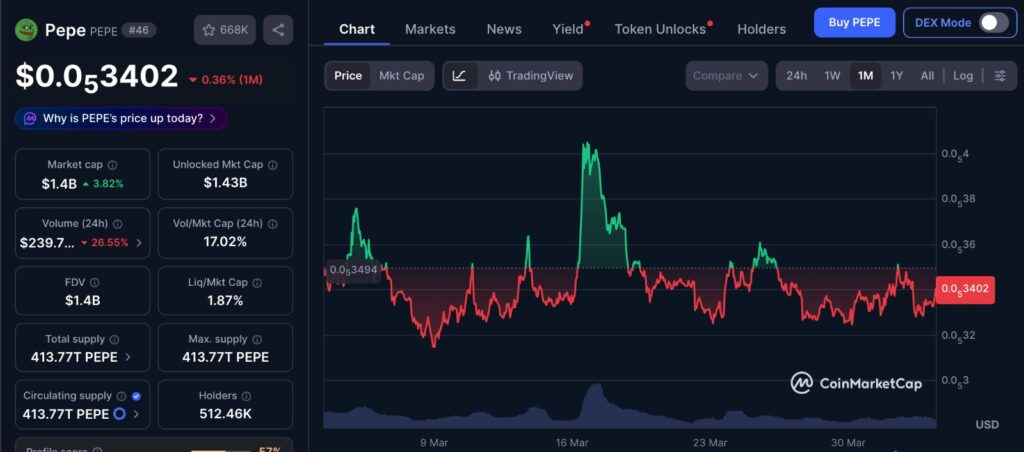
The 1-month price chart reinforces the structural weakness discussed earlier. Price has not formed a sustained recovery trend but has instead moved in short, inconsistent bursts before returning to lower levels. This type of movement reflects a market where upward momentum is not supported by strong participation. Rather than expansion, the chart shows compression around lower ranges, which typically occurs when buying pressure is insufficient to shift the broader trend.
Pepe Price Analysis shows sector strength but asset weakness
The memecoin sector has held steady over the past month, with total market capitalization largely unchanged. Compared to this, Bitcoin declined by 4.2 percent and the crypto AI sector dropped by 7.2 percent.
On the surface, this suggests relative strength. In practice, it reveals uneven capital distribution. Stability at the sector level is not being driven by broad accumulation, but by selective positioning in a few assets.
Among larger-cap memecoins, only one asset recorded gains, while PEPE and Dogecoin declined by 3.2 percent and 1.7 percent respectively. This uneven performance indicates that capital is not entering the sector with conviction. It is rotating cautiously, avoiding weaker structures rather than supporting them.
Pepe Price Analysis questions the buy the dip narrative
The appeal of buying PEPE comes primarily from its extended decline. The asset has fallen 88.4 percent over the past 18 months, creating the perception that downside may be limited.
The 0.0000028 region has also acted as a demand zone since the October crash. Multiple defenses of this level often lead to the assumption that it represents strong support.
However, support is not defined by how often it holds, but by how effectively it absorbs pressure. Each retest consumes resting buy orders. Unless new liquidity replaces what has been used, the level weakens over time.
What appears to be resilience is often redistribution. Early buyers use these reactions to exit positions, while later participants interpret the same movement as strength.
Pepe Price Analysis reveals downtrend dominance
The weekly structure confirms that PEPE remains in a sustained downtrend. There has been no meaningful shift in trend behavior, only pauses within it.
The 0.0000028 to 0.0000031 zone has been defended for two months, but the nature of that defense matters. Price has not moved away from this zone with strength. Instead, it continues to return to it.
Strong markets create distance from support. Weak markets remain anchored to it.
This repeated return suggests that demand is reactive rather than proactive. Buyers are not positioning in anticipation of higher prices. They are responding only when price reaches a perceived floor.
Why repeated support tests weaken PEPE structure
Every interaction with support reduces the available liquidity at that level. Buy orders are filled, not preserved.
If new participants do not step in with size, the next test requires less selling pressure to push price lower. This is how breakdowns are formed, through gradual depletion rather than sudden shifts.
In PEPE’s case, the two-month defense of support does not signal strength. It indicates that the market has been in a prolonged process of absorbing demand without rebuilding it.
By the time support fails, the move often appears sudden. In reality, the breakdown was prepared over multiple weeks.
Pepe Price Analysis highlights weak accumulation signals
On the 12-hour chart, the structure becomes more defined. Price continues to form lower highs, reinforcing the directional bias of the market.
At the same time, the accumulation distribution indicator trends lower. This reflects consistent outflow rather than accumulation.
Accumulation requires sustained buying that absorbs supply and stabilizes price. What is visible here is the opposite. Selling pressure is being absorbed temporarily, but not reversed.
This distinction explains why price remains near support. It is not being defended aggressively. It is being held passively until pressure builds again.
Liquidity dynamics behind Pepe’s decline
Price movement is governed by liquidity, not just intent. A market with strong buy-side depth can absorb selling without significant displacement. A market with weak depth cannot.
PEPE currently appears to be trading in an environment where buy-side liquidity is limited. This means that relatively small sell orders can move price disproportionately.
It also explains the lack of follow-through on upward moves. Without sufficient depth, rallies fail to sustain because there is not enough participation to carry price higher.
This creates an asymmetry where downside moves require less effort than recoveries.
Pepe Price Analysis identifies next downside level
The next level to watch is around 0.00000259. This level becomes relevant if the current support zone fails.
The probability of this move is not based on a single trigger. It is based on the cumulative effect of weakening structure, declining participation, and repeated testing of support.
PEPE is not consolidating in a neutral environment. It is consolidating within a downtrend. In such conditions, consolidation often serves as continuation rather than reversal.
Market behavior suggests caution, not opportunity
The idea of capturing a bottom is appealing, particularly in assets that have historically moved sharply once momentum returns.
However, markets rarely provide clear entry points during periods of structural weakness. Attempting to time reversals often leads to participation in extended drawdowns.
A more consistent approach is to observe when participation shifts. Markets tend to reward alignment with confirmed movement rather than anticipation of it.
Conclusion: A structure under pressure
Pepe Price Analysis shows a market that is not under aggressive selling, but one that is gradually losing its ability to sustain price. Support has been tested repeatedly without generating meaningful recovery, and momentum remains aligned with the downside.
The broader memecoin sector may appear stable, but PEPE’s internal structure does not reflect strength. Instead, it shows declining participation and limited accumulation.
In such conditions, support is not a foundation. It is a threshold being approached.
Editor’s View: Why support often fails quietly
Most participants focus on whether support is holding, not on how it is holding. There is a difference between active defense and passive absorption. In PEPE’s case, the reactions off support lack urgency, which suggests that buyers are not competing for position. Markets do not break when sellers become aggressive. They break when buyers stop being willing.
Disclaimer: This content is for informational purposes only and does not constitute financial advice.
Keep yourself updated with the latest crypto news with FYI Gazette
Read more about Memecoins with FYI Gazette
Keep yourself updated with the latest Altcoin News with FYI Gazette
 Bitcoin
  Ethereum
  Tether
  BNB
BNB  XRP
XRP  Solana
  TRON
TRON  Dogecoin
  Litecoin
  Pepe
Pepe