
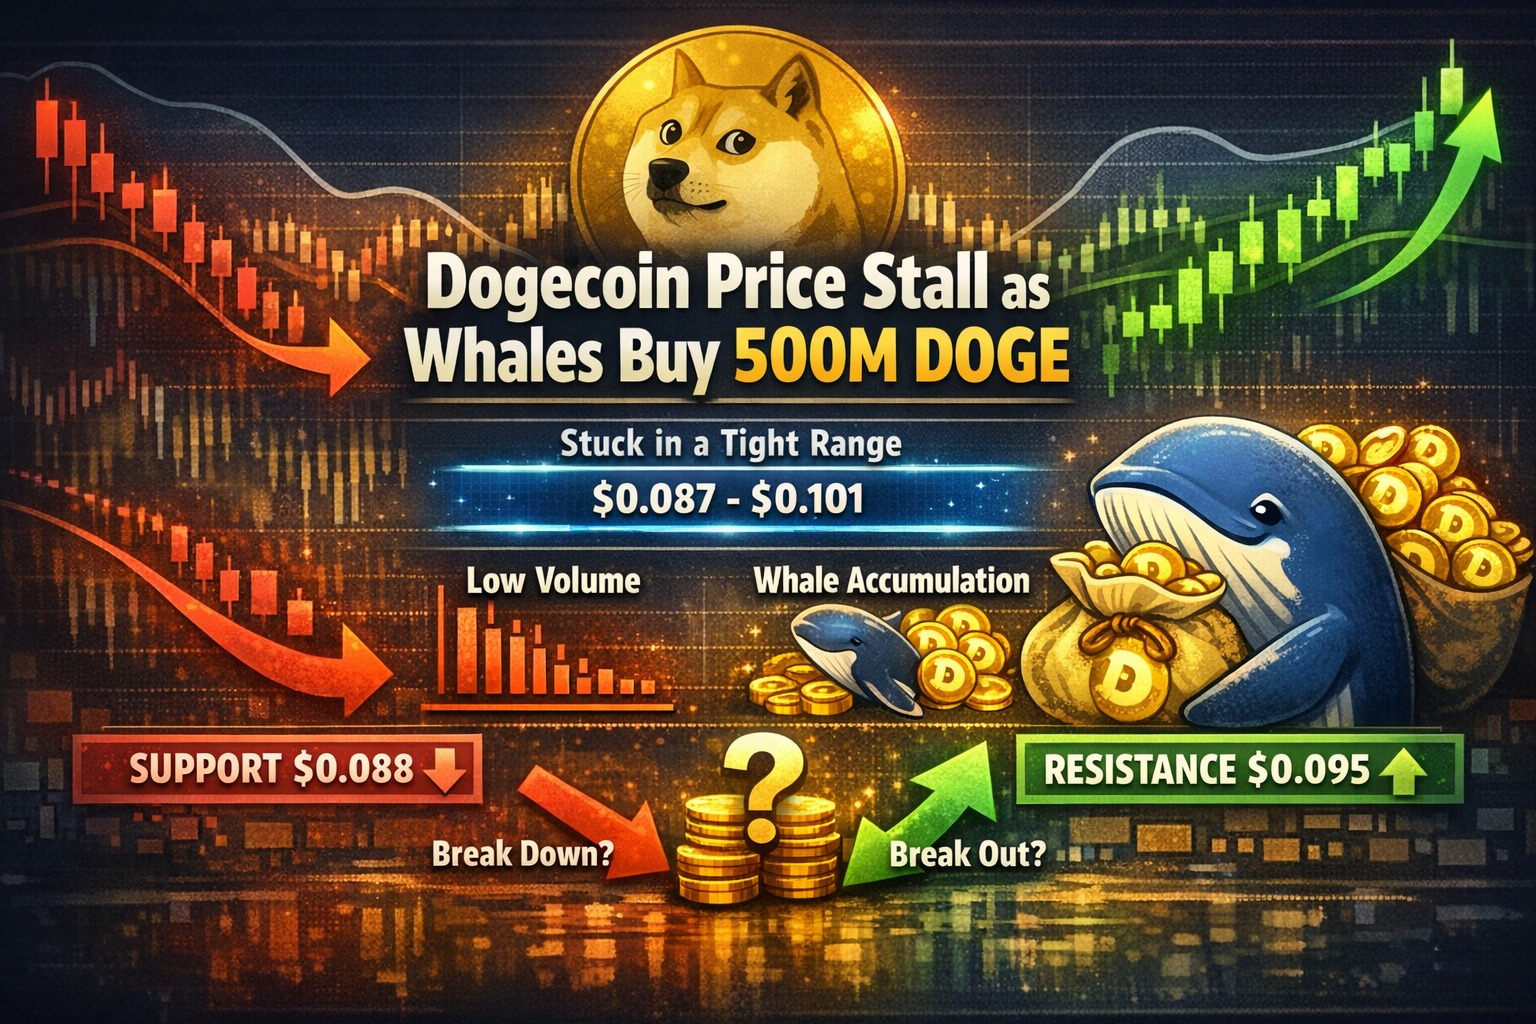
Dogecoin Price Stall as Whales Buy 500M DOGE
Dogecoin Price Stall often creates the illusion that demand has faded, when in reality it can signal that demand is being absorbed without allowing price to move. Markets tend to pause not because activity disappears, but because opposing liquidity is still strong enough to contain it. When accumulation and reduced participation happen at the same time, price becomes less reactive and more controlled. What looks like inactivity is often a phase where positioning is still being built, just without immediate visibility.
Over the past day, DOGE has struggled to break out of its range, even with strong buying activity in the background. This is why the price hasn’t moved much even though large amounts of DOGE are being accumulated.
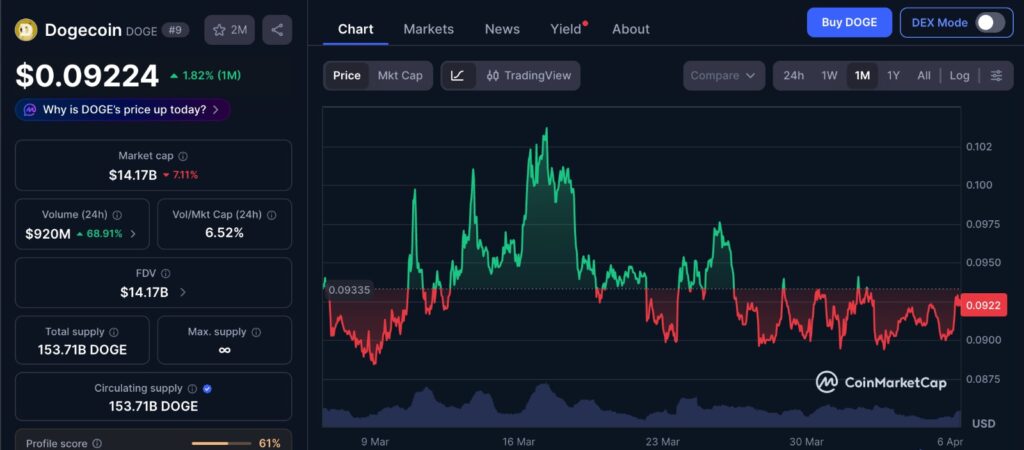
The 1-month chart reflects a prolonged phase of compression rather than directional movement. Price has repeatedly moved within a defined range, with each attempt to expand being met by opposing pressure that keeps it contained. Over this period, momentum has remained weak, with no sustained follow-through in either direction. This kind of structure typically shows a market that is active beneath the surface, but not yet ready to transition into a clear trend.
What Happened
Dogecoin has been moving within a tight range between $0.087 and $0.101 for over a week. During this time, whales have accumulated more than 500 million DOGE, according to recent market data.
At the same time, overall trading activity has slowed down. Lower volume suggests fewer traders are actively pushing the price in either direction, which is keeping DOGE stuck within this range.
Why the Market Moved
The market has not reacted strongly to whale buying because selling pressure still exists at key levels. When buyers and sellers remain balanced, price tends to move sideways instead of trending.
In simple terms, demand is being matched by supply. As long as this balance continues, price movement remains limited.
What’s Driving the Reaction
One of the main technical signals is a Bollinger Band squeeze on the daily chart. This indicates that volatility has dropped and price is compressing into a tighter range.
At the same time, the Average Directional Index is at 13.69, which shows that the current trend is weak. When trend strength is low, assets typically move sideways rather than in a clear direction.
Derivatives data also supports this view. Key liquidation levels sit around $0.0895 and $0.0932, where traders are heavily positioned. Around $11.61 million in long positions and $9.21 million in short positions are clustered at these levels.
This creates pressure zones where price tends to slow down or reverse, reinforcing the current range.
Broader Market Context
In recent sessions, crypto markets have shown similar behavior, where price holds steady despite ongoing activity. This usually happens when traders are uncertain and waiting for clearer signals before committing.
Open Interest for DOGE has also declined slightly by 0.75%, indicating that fewer traders are holding active positions. This reduction in participation often leads to slower price movement.
A descending triangle pattern is also forming on the daily chart, showing that price is gradually tightening within a narrowing range. This type of structure often builds up before a larger move, but direction depends on which side breaks first.
What This Means
For DOGE to move higher, it needs to break above the $0.095 level and close above it on the daily chart. If that happens, the current structure could support a move of around 26%.
On the downside, if price falls below the key support at $0.08821, it could drop further toward the $0.055 level.
The key takeaway is simple. Price doesn’t move just because buying increases, it moves when selling pressure starts to fade.
Editor’s View: Why sideways price can feel misleading
What makes this phase confusing is that most traders expect price to react immediately when large buying appears, but that is rarely how markets behave. When accumulation happens quietly, it often gets absorbed before it becomes visible in price action. The lack of movement can create the impression that nothing is happening, even though positioning is still building in the background. In reality, steady price during reduced participation usually reflects controlled activity rather than a lack of interest.
Conclusion
Dogecoin remains stuck in a tight range despite strong whale accumulation and ongoing activity. Lower trading volume and weak trend strength are keeping price from breaking out.
For now, the market is in a waiting phase, where both buyers and sellers remain active. A clear move will likely depend on which side loses control first, not just who is more active.
Disclaimer: This content is for informational purposes only and does not constitute financial advice.
Keep yourself updated with the latest crypto news with FYI Gazette
Read more about Memecoins with FYI Gazette
Keep yourself updated with the latest Altcoin News with FYI Gazette
 Bitcoin
  Ethereum
  Tether
  BNB
BNB  XRP
XRP  Solana
  TRON
TRON  Dogecoin
  Litecoin
  Pepe
Pepe