
Chainlink Capital Inflows Rise While Rivals See Outflows
Chainlink Capital Inflows have recently drawn attention across the crypto market as the asset continues attracting capital while many competing cryptocurrencies experience outflows. During a period where investor sentiment has turned cautious and several major digital assets have faced selling pressure, Chainlink has managed to stand out by maintaining steady inflows. This divergence has placed LINK in focus as traders examine why the asset continues to receive investment while others struggle to hold capital.
Over the past few days, the broader crypto market has seen a shift toward defensive positioning. Investors began pulling funds from several large cryptocurrencies as uncertainty returned to the market. Assets such as Bitcoin, Ethereum, XRP, and Solana all recorded noticeable capital outflows during this period.
However, Chainlink did not follow this pattern. Instead of experiencing the same wave of selling pressure, LINK attracted new capital during the same timeframe. This difference highlights how some investors may be reallocating funds toward projects that appear more stable or fundamentally strong.
The contrast between Chainlink and other major cryptocurrencies has therefore become an important development for market observers.
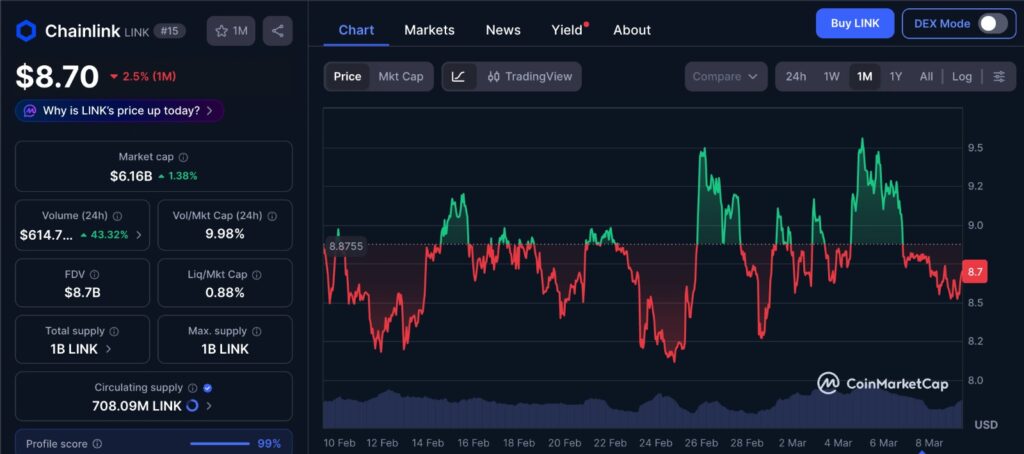
The one month price chart for Chainlink shows how the asset has been navigating a period of broader market uncertainty. While several major cryptocurrencies have experienced capital outflows, LINK has managed to maintain relatively stable price behavior during this timeframe. The chart reflects repeated tests of key resistance levels, while buyers have continued stepping in at higher support zones. This pattern suggests that market participants are closely watching whether sustained capital inflows can eventually translate into stronger price momentum.
Chainlink Capital Inflows Supported by Development Activity
One factor helping explain the strength behind Chainlink capital inflows is the network’s continued development activity. Data from Santiment recently showed that Chainlink ranked among the most actively developed crypto projects over the past month.
According to the data, Chainlink held the third position in development activity during the previous 30 days. The only projects ranking above it were MetaMask USD and Hedera.
Development activity is often viewed as a strong indicator of long term commitment within a blockchain ecosystem. Projects that maintain consistent development typically demonstrate that teams are continuing to improve infrastructure, introduce upgrades, and expand functionality.
When development activity slows down, investors sometimes interpret it as a signal that a project may be losing momentum. In contrast, strong development metrics suggest that work behind the scenes remains active.
Chainlink maintaining a top position in this ranking therefore reinforces investor confidence in the project. The continued technical progress around the network appears to support the narrative that LINK remains one of the more actively maintained ecosystems in the crypto space.
Chainlink Capital Inflows Stand Out During Market Weakness
The difference between Chainlink and the rest of the market becomes clearer when looking at recent capital flow data.
On March 5, Chainlink recorded inflows of approximately 1.93 million dollars. The following day, the asset continued attracting investment with an additional 935 thousand dollars flowing into the market.
These consecutive inflows occurred at a time when several major cryptocurrencies were experiencing the opposite trend. Bitcoin, Ethereum, XRP, and Solana all saw capital leaving their markets during the same period.
Such divergence can sometimes signal changing investor behavior. During uncertain market conditions, traders often rotate funds toward assets they believe may offer stronger resilience.
In this case, Chainlink appears to have benefited from that shift in sentiment. Rather than being caught in the same wave of outflows affecting other cryptocurrencies, the project continued attracting fresh capital.
While short term inflows do not automatically guarantee sustained growth, they often signal that market participants are paying closer attention to the asset.
Price Structure Around Chainlink Capital Inflows
Beyond the capital inflows, Chainlink’s price structure is also playing an important role in how the market evaluates the asset.
Recent price movements show that LINK has been forming an ascending triangle pattern on the charts. This type of formation typically appears when price repeatedly tests a resistance level while creating higher lows over time.
For Chainlink, the key resistance level currently sits near 9.17 dollars. Price has approached this level multiple times but has not yet managed to break above it.
At the same time, support has gradually been moving upward. This pattern indicates that buyers are stepping in at higher levels, preventing deeper declines.
The next major support level is located near 8.30 dollars. If the price revisits this area, it could become an important level where buyers attempt to defend the trend.
Ascending triangles often represent a period of tension between buyers and sellers. Resistance acts as a barrier where supply remains strong, while rising support reflects increasing demand.
Eventually, one side typically gains control and pushes price outside the pattern.
Momentum Signals Show Early Signs of Improvement
Technical indicators currently suggest that bearish momentum may be slowly weakening.
The Relative Strength Index has begun showing signs of stabilization, suggesting that selling pressure may be fading. Although the indicator has not yet moved into strong bullish territory, the shift indicates that market conditions could be gradually improving.
At the same time, the Moving Average Convergence Divergence indicator has started to show a mild positive crossover. This development points toward a possible improvement in short term momentum.
However, both indicators remain relatively neutral for now. They hint at improving conditions but do not yet confirm a decisive bullish trend.
Editor’s View: Why Capital Often Moves Quietly Before Price
When capital begins flowing into a single asset while the rest of the market sees outflows, it often reflects subtle shifts in investor positioning rather than sudden optimism. Traders sometimes look for projects where underlying activity remains steady even as broader sentiment weakens. In those moments, development progress and network relevance can quietly influence allocation decisions. This kind of behavior rarely shows up clearly on price charts, but it often explains why certain assets attract attention even during cautious market phases.
Chainlink Capital Inflows Still Require Price Confirmation
Despite the positive signals from development activity and capital flows, the market still requires confirmation through price action.
Capital inflows can indicate growing interest in an asset, but they do not guarantee sustained upward movement. Ultimately, price behavior determines whether demand is strong enough to overcome selling pressure.
For Chainlink, the resistance level near 9.17 dollars remains the most important level to watch. A clear breakout above this level could signal that buyers have gained stronger control of the market structure.
On the other hand, if price falls below the 8.30 support level, it could weaken the bullish outlook that has been forming.
For now, Chainlink remains one of the few cryptocurrencies showing consistent inflows while much of the broader market faces outflows. Whether this divergence continues will depend largely on how price reacts around the key technical levels in the coming sessions.
Disclaimer: This content is for informational purposes only and does not constitute financial advice.
Keep yourself updated with the latest crypto news with FYI Gazette
Read more about Memecoins with FYI Gazette
Keep yourself updated with the latest Altcoin News with FYI Gazette
 Bitcoin
  Ethereum
  Tether
  BNB
BNB  XRP
XRP  Solana
  Dogecoin
  Litecoin
  Pepe
Pepe