
Ether Price Holds $2K as Traders Target Short Liquidity
Ether Price climbed back above the $2,000 level at the start of the week as activity across Ethereum derivatives markets intensified. Data shows that more than 110,000 ETH flowed into derivatives exchanges while a key leverage indicator climbed to a new high. The increase in derivatives activity suggests that traders are positioning for larger price swings as Ethereum attempts to move beyond its current monthly trading range.
The renewed activity reflects a buildup of speculative positioning in the market. When derivatives flows increase alongside leverage usage, it often signals that traders are preparing for heightened volatility. As Ethereum stabilizes above the $2,000 mark, market participants are now focusing on liquidity zones that sit slightly above the current price.
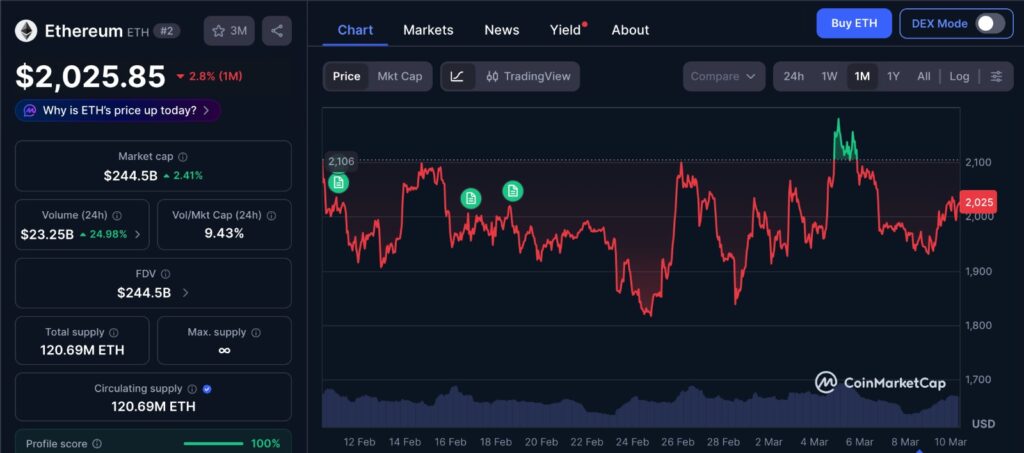
This one-month chart of Ethereum highlights how the market has repeatedly reacted around the $1,900 to $2,050 range over recent weeks. Rather than trending in a straight direction, the price has moved through cycles of quick rallies and equally sharp pullbacks, reflecting a market dominated by short-term positioning. Such behavior often appears when traders rely heavily on leverage, as small moves trigger liquidations that quickly shift momentum. The chart therefore shows not only price movement, but also the ongoing struggle between buyers defending key levels and traders attempting to capture short-term volatility.
Ether Price Sees Surge in Derivatives Exchange Inflows
Derivatives exchanges recorded a large spike in Ether inflows on March 7, with a total of 110,343 ETH entering derivatives platforms. This marked the third largest spike in derivatives inflows recorded during 2026.
A similar surge occurred earlier this year on Feb. 6. At that time, Ethereum rallied approximately 13 percent from its yearly low of $1,736. Historically, sharp increases in derivatives inflows have often been followed by periods of increased volatility or short term corrections.
When large amounts of Ether move into derivatives exchanges, it typically signals that traders are preparing to open leveraged positions. Unlike spot exchanges, derivatives platforms are mainly used for futures and perpetual contracts, which allow traders to speculate on price movements using borrowed capital.
Because of this, derivatives inflows are often interpreted as a sign of speculative positioning rather than long term investment. The latest spike therefore indicates that traders are preparing for a potentially volatile period in the Ethereum market.
Ether Price Leverage Ratio Reaches Record Level
Alongside the rise in derivatives inflows, Ether’s estimated leverage ratio also climbed to a new record level of 0.78. This metric measures the amount of open interest in derivatives markets relative to the Ether held in exchange reserves.
The new reading slightly exceeds the previous record of 0.778 that was recorded on Jan. 1. A rising leverage ratio indicates that traders are increasingly relying on borrowed capital to increase their exposure to the market.
Higher leverage can amplify price movements in either direction. When markets become highly leveraged, even small price changes can trigger liquidations that accelerate price momentum.
This means that if Ethereum moves strongly in one direction, forced liquidations from leveraged positions could rapidly intensify the move. As a result, periods of elevated leverage often coincide with higher volatility in the market.
Ether Price Continues to Trade Inside Monthly Range
Despite reclaiming the $2,000 level, Ethereum is still trading within a broader monthly range between approximately $1,800 and $2,000. This range developed after a swing failure pattern occurred near $2,150 last week.
The rejection near $2,150 indicated that traders began taking profits after the price briefly moved above previous highs. Following this rejection, Ethereum retraced toward internal liquidity levels around $1,900 and $1,950.
These areas were formed earlier during last week’s consolidation and acted as zones where traders accumulated positions. After the retracement, Ethereum experienced a liquidity sweep near $1,908 on Sunday before rebounding.
The move cleared stop orders below recent lows and allowed price to recover. On shorter timeframes, the rebound created a bullish pivot that supported the recovery back above $2,000.
Ether Price Faces Liquidity Cluster Above $2,050
Attention is now shifting toward the next resistance zone located between $2,050 and $2,100. This region formed late last week and represents an area where selling pressure previously entered the market.
If Ethereum manages to break above this zone and establish it as support, the market could attempt another move toward the $2,150 level that previously capped the rally.
Liquidation data also shows a large cluster of short positions positioned above the current price. Approximately $273 million in cumulative short liquidation leverage is located near the $2,030 level.
Large concentrations of short liquidations often attract price movement because they represent areas where traders betting against the market may be forced to close their positions.
If the price moves into these zones, forced buybacks from short sellers can create additional upward pressure. When multiple liquidation levels are triggered in a short period of time, the resulting volatility can accelerate price movement.
Editor’s View: Why the $2,000 Level Continues to Attract Positioning
The behavior around the $2,000 level reflects more than just technical structure. Round price levels tend to draw both confidence and hesitation from traders, which is why positioning often builds rapidly around them. In Ethereum’s case, the rising leverage ratio suggests that many participants are attempting to anticipate the next move rather than reacting to it. When markets reach this stage, price action is often shaped less by charts themselves and more by how crowded those expectations become on either side of the trade.
Long Term Support Remains Important for Ether Price
While traders focus on overhead liquidity, Ethereum is also testing a long term ascending trendline that has supported the asset during previous market cycles.
This trendline has acted as a key support level multiple times in the past. Each time the price touched this support zone, Ethereum eventually experienced a strong bounce.
Because of this historical behavior, the region between $1,900 and $2,000 is currently viewed as a critical support zone that could influence the next major move.
Holding above this level would reinforce the current recovery structure and keep attention on the liquidity clusters above the market.
For now, the Ether Price remains positioned between strong support near $1,900 and resistance levels above $2,050. The combination of rising leverage, derivatives inflows, and concentrated liquidation levels suggests that Ethereum’s next move could come with increased volatility as traders continue to position around these key zones.
Disclaimer: This content is for informational purposes only and does not constitute financial advice.
Keep yourself updated with the latest crypto news with FYI Gazette
Read more about Memecoins with FYI Gazette
Keep yourself updated with the latest Altcoin News with FYI Gazette
 Bitcoin
  Ethereum
  Tether
  BNB
BNB  XRP
XRP  Solana
  Dogecoin
  Litecoin
  Pepe
Pepe