
Avalanche Volume Nears 1T As AVAX Tests Key Support
Avalanche Volume continues climbing as AVAX enters December with notable improvements across both on chain activity and price structure. The network has shown measurable signs of stabilization, and these developments have caught the attention of traders monitoring whether the current consolidation will lead to a sustainable recovery. With volume nearing the one trillion mark and price approaching a critical support area, the coming weeks may determine the direction of Avalanche’s next major move.
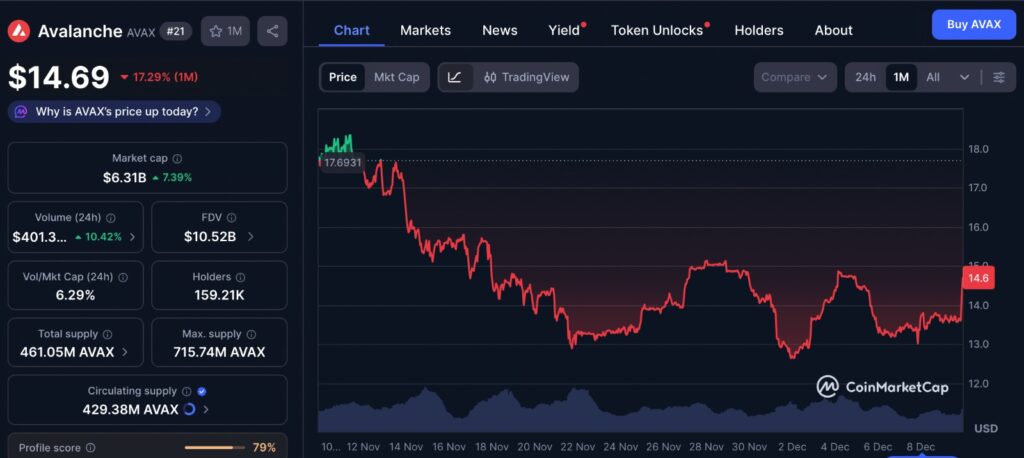
The accompanying one month chart from CMC highlights how AVAX has moved within its tightening consolidation range while repeatedly interacting with the key support and resistance zones discussed above. Although short term momentum has fluctuated, the overall structure shows buyers attempting to stabilize price action despite broader market uncertainty. This visual snapshot underscores the importance of the 12.82–13.00 support zone, as the chart reveals how closely AVAX has been tracking this level throughout the recent trading period. As on chain activity continues to rise, the chart helps contextualize whether market participants are responding by gradually rebuilding confidence during this phase of compression.
Avalanche Volume and Strengthening On Chain Activity
Avalanche began December with a consistent rise in C Chain transactions, reinforcing the idea that users were relying on the network for ongoing activity rather than temporary spikes. This trend continued throughout 2025, suggesting that Avalanche was being used with purpose instead of reacting to short lived bursts of sentiment. The broader growth created a foundation for assessing long term viability because recurring usage often signals a maturing ecosystem.
As network activity strengthened, technical indicators also began showing signs of gradual improvement. The daily RSI hovered around the mid forties, reflecting a slow but noticeable recovery in momentum. Meanwhile, the weekly RSI settled near the upper thirties, a region that historically aligns with the token’s long term bottom structure. Since its early trading history, an RSI zone around thirty has acted as a recurring floor for AVAX, making the current position significant for traders evaluating whether a reversal is forming. Still, these indicators required further confirmation through steady price action at the lower band of consolidation.
Avalanche Volume Approaches One Trillion
Avalanche Volume surged toward nine hundred ninety billion, placing the network on the threshold of reaching one trillion in cumulative activity. This rise in volume created a strong signal of ongoing demand despite broader market weakness. When a blockchain maintains rising volume during uncertain conditions, it often reflects genuine utility rather than sentiment driven movement. For AVAX, this expanding activity reinforced the structural foundation of its recent breakout attempt by showing that participation was still climbing.
Growing cumulative volume also highlighted that Avalanche’s ecosystem was continuing to attract usage across various applications. As more transactions moved through the network, confidence increased that the underlying structure supporting price action was developing in a healthy direction. Avalanche Volume therefore became a key metric for evaluating whether the network’s momentum could sustain itself during a challenging market environment.
User Growth and C Chain Engagement
User participation experienced similar expansion as monthly C Chain transactions passed sixty million by the fourth quarter. This increase represented meaningful engagement rather than isolated bursts of traffic. For long term investors, such consistency matters because steady activity helps demonstrate whether a blockchain delivers value regardless of price fluctuations. Sustained growth in transactions reinforces the idea that Avalanche is building real usage cycles that extend beyond speculative movements.
The link between Avalanche Volume and user growth indicates that both metrics are rising in tandem. When participation and volume climb together, networks tend to show stronger resilience against volatility. These conditions helped shape a more stable backdrop for AVAX as it approached a crucial technical level.
Avalanche Volume and the Critical Support Zone
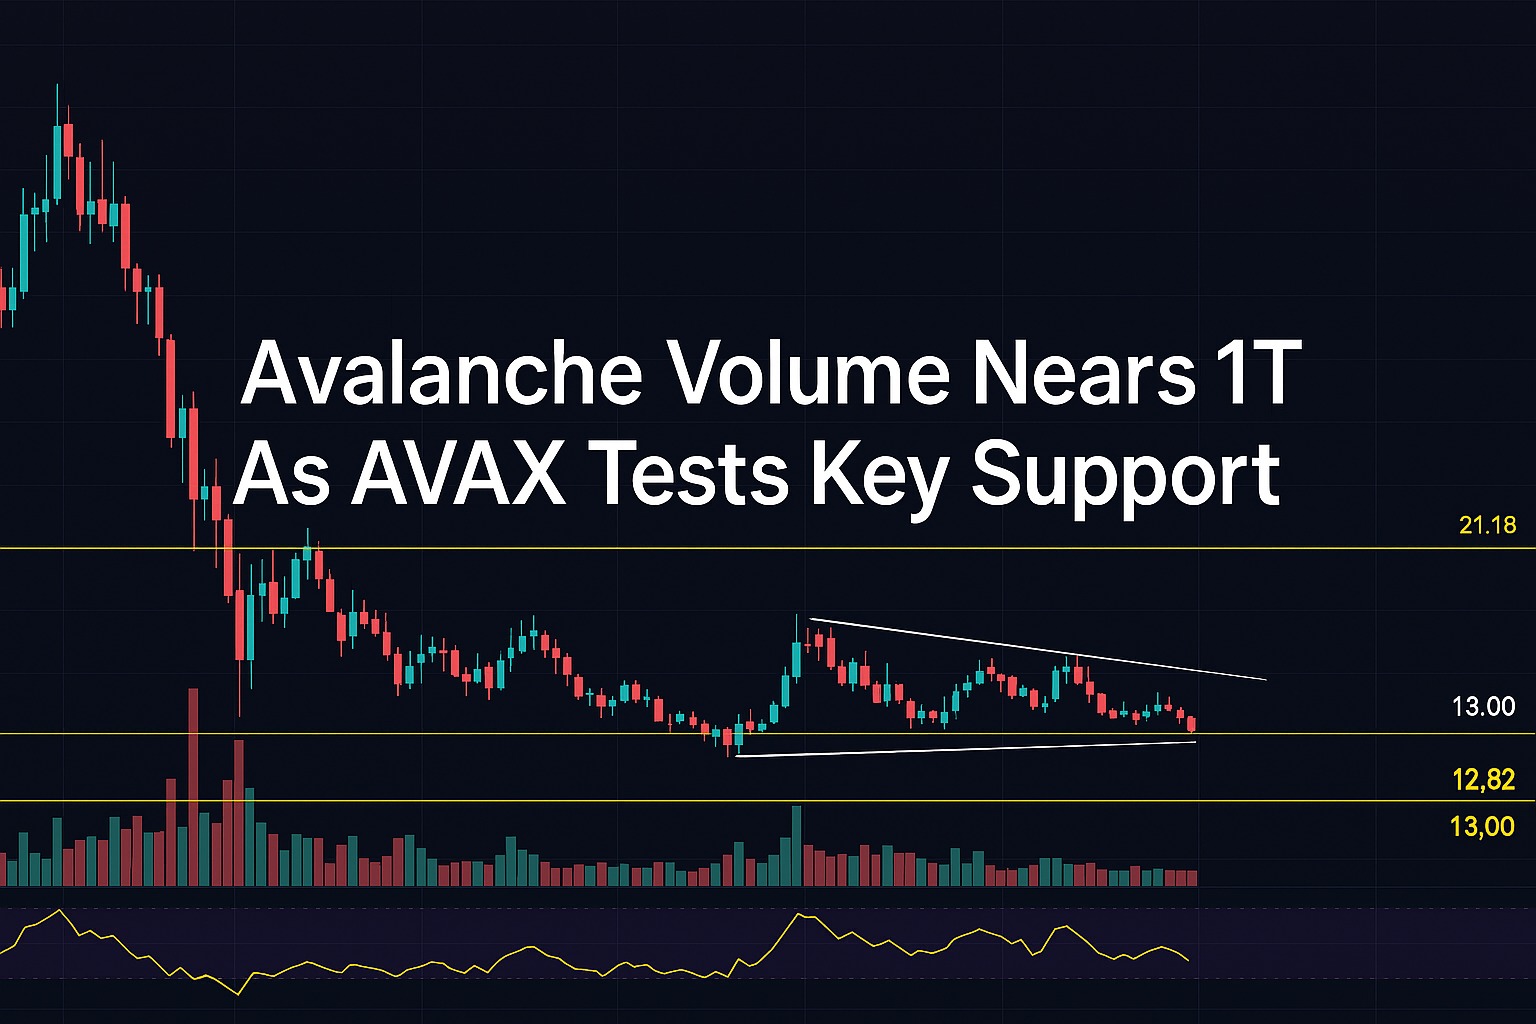
On the price chart, AVAX displayed tightening consolidation on both the daily and four hour timeframes. Buyers attempted to maintain structure while the token approached the essential support range between 12.82 and 13.00. This level now acts as the defining test for the breakout. If AVAX can hold above it, the breakout structure remains valid. If price falls below the zone, it may re enter the previous wedge pattern and weaken the reversal attempt.
Traders are monitoring this support closely because it serves as the dividing line between continuation and breakdown. Avalanche Volume provides encouraging context, but price must still prove stability for momentum to shift meaningfully.
Resistance Levels and Reversal Conditions
Local resistance sits at 18.74, with mid level resistance near 21.18 and macro resistance at 24.15. A daily break above the macro region would strengthen bullish momentum. However, the most decisive confirmation would come from a weekly close through the 24 to 27 range. Such a move would signal a complete multiyear trend reversal and reestablish AVAX’s long term bullish trajectory.
Analysts note that if Avalanche Volume and on chain activity continue expanding at their current pace, the broader structure could support upward movement over time. With stronger utility serving as the backbone of network development, a sustained shift in momentum could eventually push AVAX toward significantly higher valuation regions.
What Rising Avalanche Volume Means for Investors
Avalanche now aligns rising utility, deeper liquidity, and improving technical structure. Together, these elements create a stronger framework for evaluating long term positioning. Investors who focus on fundamentals often view increasing volume and steady user participation as indicators that a blockchain is entering a healthier growth phase.
Still, caution remains important. While Avalanche Volume shows momentum, price action must confirm direction by defending support and breaking through resistance levels. If the token fails to maintain the 12.82 to 13.00 area, the risk of renewed downside increases. Conversely, success in holding the range could set the stage for larger structural recovery.
Final Thoughts
Avalanche Volume nearing one trillion underscores the growing strength of the network. The convergence of expanding activity, rising engagement, and improved price structure places AVAX at a pivotal moment. To preserve the breakout, AVAX must defend the 12.82 to 13.00 support zone. A weekly close above the 24 to 27 region would confirm a multiyear reversal and potentially open the path toward broader upside. With on chain demand still increasing, Avalanche now stands at a critical point that may shape the next phase of its market trajectory.
Keep yourself updated with the latest crypto news with FYI Gazette
Read more about Memecoins with FYI Gazette
Keep yourself updated with the latest Altcoin News with FYI Gazette
 Bitcoin
  Ethereum
  Tether
  BNB
BNB  XRP
XRP  Solana
  TRON
TRON  Dogecoin
  Litecoin
  Pepe
Pepe