

Bitcoin Price Falls Under $70K Again
Bitcoin Price slipped back below the $70,000 level after losing roughly 5% over the past two days, pushing the asset back into its broader monthly trading range. The decline comes after Bitcoin briefly rallied toward $74,000 earlier this week but failed to maintain momentum near those highs. Market data now points to renewed selling pressure, with onchain activity, derivatives indicators and weakening spot demand all suggesting that the recent rally struggled to sustain strength.
The pullback highlights how sensitive Bitcoin remains to resistance levels near $70,000. While the broader market structure remains intact, short-term traders appear to be locking in profits as BTC approaches higher price zones. At the same time, liquidity conditions and demand signals indicate that buyers have recently become more cautious.
Several factors contributed to the move back below $70,000, including profit-taking by short-term holders, increased selling pressure in futures markets, and fading demand from US-based traders.
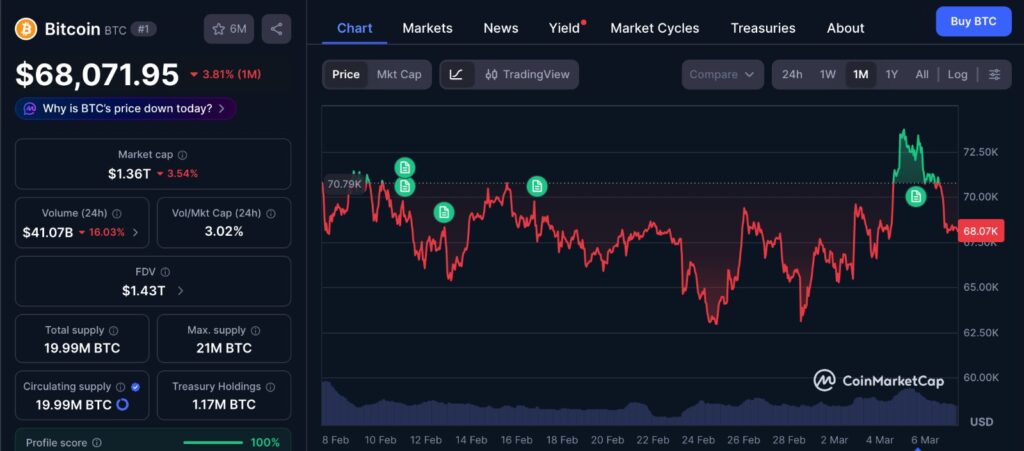
The chart below shows Bitcoin’s price movement over the past month, highlighting the recent pullback that pushed the Bitcoin Price back below the $70,000 level. After briefly rallying toward the $73,000 to $74,000 range, BTC struggled to sustain momentum as selling pressure increased across the market. The one-month chart helps illustrate how the latest decline fits within a broader consolidation phase, where Bitcoin has repeatedly tested resistance near $70K while finding support closer to the mid-$60K range. Such patterns often reflect shifting trader positioning rather than a single isolated event driving the move.
Bitcoin Price Faces Resistance Near $70K
The recent Bitcoin Price movement shows that the $70,000 region continues to act as an important resistance level for the market. Bitcoin briefly traded above this level earlier in the week during a rally that pushed prices toward the $73,000 to $74,000 range.
However, the market struggled to sustain momentum once it approached those highs. Without strong follow-through buying pressure, the rally began to slow and sellers gradually stepped in.
When price fails to maintain strength near key resistance zones, it often signals that traders are choosing to secure profits rather than extend their positions. That dynamic appears to have played a role in Bitcoin’s latest move lower.
As a result, BTC slipped back under $70,000 and returned to its broader trading range that has defined much of the recent price action.
Bitcoin Price Drop Triggered by Short-Term Holder Profit-Taking
Data shows that more than 27,000 BTC in realized profit moved to exchanges from wallets belonging to short-term investors within a 24-hour period. This spike represents one of the largest waves of profit-taking from this group since late 2025.
Short-term holders typically react quickly to market movements because they hold Bitcoin for relatively brief periods, often ranging from several days to a few weeks.
Many of the coins that were transferred to exchanges had been accumulated between one week and one month earlier, when the average realized price for those holders was close to $68,000.
As Bitcoin climbed above $73,000, these investors were able to lock in gains from their positions. When coins move to exchanges, it usually signals the intention to sell, which increases supply in the market.
This surge in exchange inflows from short-term holders created additional selling pressure and contributed to the price falling back below $70,000.
Bitcoin Futures Data Shows Growing Selling Pressure
Negative CVD Signals Seller Dominance
Derivatives market indicators also show that selling activity increased as Bitcoin approached recent highs.
The cumulative volume delta, or CVD, recently turned negative in both spot and perpetual futures markets. The CVD measures the difference between buy volume and sell volume and helps identify whether buyers or sellers are dominating trading activity.
A negative reading indicates that selling pressure is stronger than buying demand.
Recent data showed that the spot market CVD dropped to approximately negative $202 million, while the perpetual futures market recorded around negative $185 million.
These figures suggest that sellers were consistently more aggressive than buyers during the period when Bitcoin slipped back below $70,000.
Another important factor was the decline in bid liquidity. When buy orders become thinner in the order book, prices can fall more easily because there are fewer buyers available to absorb sell orders.
Together, the negative CVD readings and reduced liquidity highlight a shift in short-term momentum toward the selling side of the market.
Weakening US Demand Adds Pressure on Bitcoin Price
Coinbase Premium Index Turns Negative
Another signal of slowing demand came from the Coinbase Premium Index, which measures the price difference between Bitcoin on Coinbase and other international exchanges.
Positive readings generally indicate strong demand from US-based investors since Coinbase is widely used by American traders and institutions.
During Bitcoin’s rally toward the $73,000 to $74,000 range earlier in the week, the premium briefly rose above 0.08, signaling strong buying activity from Coinbase users.
However, the premium quickly faded once the price reversed from $74,000. Shortly afterward, the indicator turned negative, suggesting that demand from US traders had weakened.
When buying interest declines near important resistance levels, it often becomes difficult for the market to maintain upward momentum.
Editor’s View: Why Bitcoin Price Often Struggles Near Major Round Numbers
Large psychological levels such as $70,000 often influence trader behavior more than technical indicators alone. When Bitcoin approaches these levels after a quick rally, many short-term participants choose to reduce exposure and lock in profits rather than extend risk. This behavior can temporarily overwhelm buying pressure even if the broader market structure has not materially changed. As a result, pullbacks around widely watched price milestones often reflect positioning adjustments rather than a sudden shift in long-term sentiment.
Key Support Levels for Bitcoin Price
Traders Watch $67K to $68K Range
With Bitcoin now trading below $70,000 again, traders are closely watching nearby support levels.
Some analysts believe the $67,000 to $68,000 range could act as an important short-term support zone. If Bitcoin manages to hold this level, it may help stabilize the market structure following the recent pullback.
There is also a potential fair value gap near the $66,500 level. A fair value gap forms when price moves quickly and leaves behind an area with relatively little trading activity.
Markets sometimes revisit these zones as they rebalance liquidity before continuing their broader trend.
If Bitcoin moves toward this area, traders will watch closely for signs of renewed buying interest.
For now, the latest decline highlights how the Bitcoin Price remains influenced by profit-taking activity, derivatives market dynamics and shifts in spot demand. The market continues to balance between strong long-term interest and short-term trading behavior that often drives temporary price fluctuations.
Disclaimer: This content is for informational purposes only and does not constitute financial advice.
Keep yourself updated with the latest crypto news with FYI Gazette
Read more about Memecoins with FYI Gazette
Keep yourself updated with the latest Altcoin News with FYI Gazette
 Bitcoin
  Ethereum
  Tether
  BNB
BNB  XRP
XRP  Solana
  TRON
TRON  Dogecoin
  Litecoin
  Pepe
Pepe