
Bitcoin Price Support Reclaimed as BTC Holds Above $70K
Bitcoin Price Support returned to the spotlight as Bitcoin pushed higher over the weekend, with bulls attempting to secure a weekly close above the key $70,000 level. The move came after several days of fluctuating price action that briefly raised concerns about whether the market could maintain its broader bullish structure.
At the time of the move, Bitcoin traded near $73,712, reflecting renewed momentum after a period of uncertainty. The latest push higher allowed the asset to stay above several important technical levels that traders have been watching closely.
The weekend rally also suggested that buyers remain willing to defend major support zones despite ongoing macro uncertainty. Holding above $70,000 has become increasingly important for the market’s short term structure, making the level a focal point for traders and analysts.
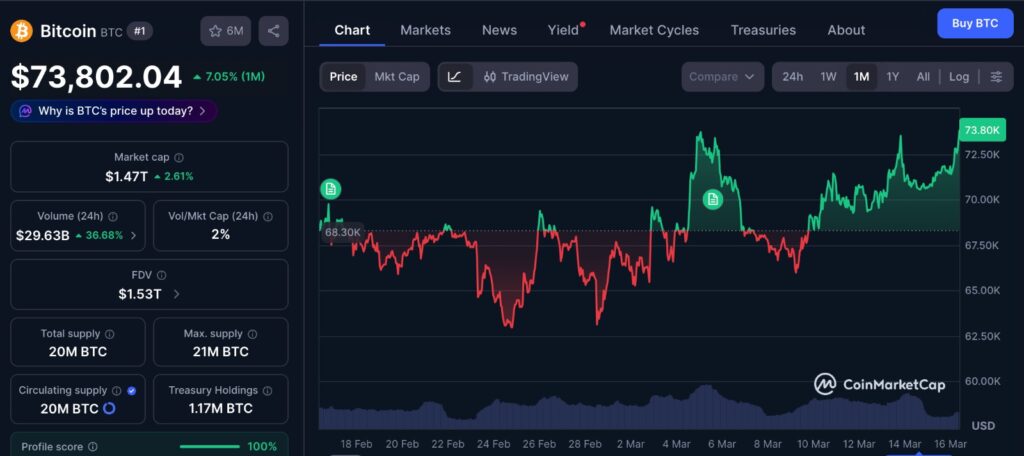
The one-month price chart from CoinMarketCap shows how Bitcoin’s recent push above $70,000 developed gradually rather than through a single sharp rally. Over the past several weeks, price movements have reflected a pattern of pullbacks followed by steady recoveries, suggesting that buyers continue to step in during dips. This type of structure often indicates a market where participants are still actively repositioning rather than exiting. The chart also highlights how closely Bitcoin has been trading around key psychological levels, reinforcing why the $70,000 area has become such an important point of attention for traders.
Bitcoin Price Support Reclaims $70K Level
Bitcoin price action showed a steady climb over the weekend, with BTC moving back above $70,000 and briefly approaching the $72,000 area before cooling slightly.
Data from market charts showed the move occurring during quieter weekend trading hours. Despite the lower liquidity typically seen during these periods, the recovery helped reinforce confidence that the $70,000 level remains a key support zone.
The move also positioned Bitcoin for its seventh consecutive green daily candle. If confirmed, that would mark the highest daily close since March 4, highlighting a gradual recovery in bullish momentum after earlier volatility.
Maintaining price above $70,000 is also significant because the level aligns with other important technical indicators that traders often use to gauge long term trend strength.
Long Term Indicators Strengthen Bitcoin Price Support
In addition to the psychological significance of $70,000, Bitcoin has also managed to remain above several key long term benchmarks.
These include the 200 week exponential moving average and the previous all time highs from 2021. The old peak levels around $68,300 and $69,400 have historically acted as strong reference points for market participants.
Staying above these levels suggests that the broader trend remains intact for now. When Bitcoin trades above long term moving averages and former highs, it often signals that the market structure is still constructive despite short term volatility.
Traders therefore continue to monitor how the price behaves around these areas as the market moves into a new trading week.
Analyst Views on the Recent Correction
Some analysts have argued that the recent dip seen late last week was not necessarily a sign of weakness.
Crypto trader Michaël van de Poppe explained that the drop on Friday appeared to be largely driven by traders reducing exposure ahead of the weekend. According to his view, the correction was more about risk management than a shift in the broader market trend.
He noted that once the weekend began, the market quickly started moving upward again. In his analysis, the price may still revisit certain levels before continuing its movement toward higher resistance areas.
Van de Poppe also pointed to the potential for a temporary pullback that could fill the gap left by the closing price of Bitcoin futures on the CME exchange.
CME Gap and Short Term Price Movements
One of the levels highlighted by traders was the CME futures closing price of $71,325 from Friday.
Bitcoin often revisits these gaps when the futures market closes for the weekend and reopens later. As a result, many traders track these areas as potential short term magnets for price action.
The recent move in Bitcoin did in fact return to this level, aligning with expectations from analysts who anticipated a revisit of the gap.
Such movements are common in the cryptocurrency market, where technical levels and liquidity zones frequently influence short term price swings.
Profit Taking Near Local Highs
While Bitcoin has shown strength above $70,000, selling pressure has continued to appear when the price moves higher.
According to market analysis, the selling activity seen near recent highs does not appear to be panic driven. Instead, it reflects steady profit taking from traders who accumulated positions at lower prices.
This behavior is typical during periods when an asset approaches major resistance areas. Traders who entered earlier positions may choose to lock in gains, creating temporary downward pressure even during a broader upward trend.
As a result, Bitcoin’s price movement often includes periods of consolidation as the market absorbs selling activity.
Macro Risks Still Affect Bitcoin Price Support
Beyond technical levels, macroeconomic developments continue to influence sentiment in the cryptocurrency market.
Geopolitical tensions have remained a major topic of discussion among traders. At the same time, developments in global energy markets have added another layer of uncertainty.
During the same period, West Texas Intermediate crude oil prices were attempting to move back toward the $100 per barrel mark. The ongoing supply shock in oil markets has raised concerns about broader economic impacts.
Some analysts believe that if macro conditions were more stable, Bitcoin’s current structure could potentially evolve into a stronger recovery move. However, the current environment means that downside risks cannot be completely ruled out.
Editor’s View: Why Bitcoin Price Support Keeps Drawing Buyers
The repeated defense of the $70,000 level reveals more than just a technical reaction on charts. Large psychological levels often become anchors for trader behavior, especially after they have acted as resistance in previous cycles. When Bitcoin moves above such levels and then retests them, market participants tend to watch closely to see whether confidence holds. The steady buying interest around this area suggests that many traders now view dips toward $70,000 as a place to manage positions rather than abandon them.
Trading Range Defines the Next Phase
Market analysts have also identified a broader trading range that could shape Bitcoin’s medium term behavior.
One estimate places the true market mean near $78,400. On the lower end, the realized price of the current circulating supply sits near $54,400.
These levels create a wide band that may define Bitcoin’s mid term price action. Movements within this range could continue as the market searches for its next major direction.
Within this structure, the $70,000 level remains a key reference point.
Each time Bitcoin moves above that level, sellers tend to emerge. However, the selling so far appears to represent controlled profit taking rather than aggressive distribution.
For now, Bitcoin price support around $70,000 continues to hold the attention of traders, who are watching closely to see whether the market can maintain its position above this crucial level.
Disclaimer: This content is for informational purposes only and does not constitute financial advice.
Keep yourself updated with the latest crypto news with FYI Gazette
Read more about Memecoins with FYI Gazette
Keep yourself updated with the latest Altcoin News with FYI Gazette
 Bitcoin
  Ethereum
  Tether
  BNB
BNB  XRP
XRP  Solana
  TRON
TRON  Dogecoin
  Litecoin
  Pepe
Pepe