
Solana Bullish Signal Returns But This Time, Structure Matters More Than the Signal
Solana bullish signal is once again drawing attention across the market, but the context this time is very different from prior cycles. What appears as a familiar technical trigger is forming within a tighter and more constrained market structure. That distinction is what separates a repeat rally from a slower, more conditional move.
Recent developments show that Solana has printed a weekly MACD crossover, a signal that historically preceded strong upside expansions, including rallies ranging from 100% to as high as 800% in past cycles.
But signals alone do not move markets. Positioning does.
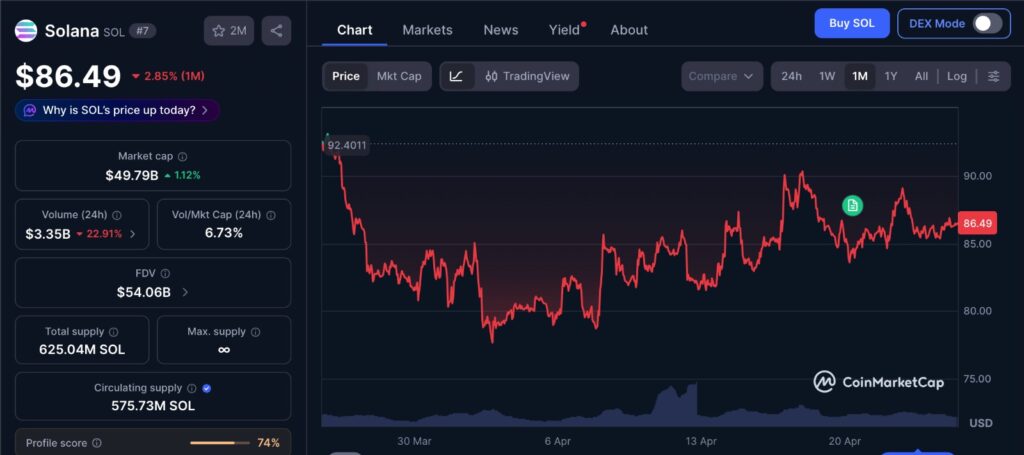
Over the past month, Solana’s price action has reflected a gradual transition from sharp downside pressure to tighter consolidation. The chart shows multiple attempts to push higher, but each move has slowed near the same resistance zone, indicating consistent supply at those levels. At the same time, pullbacks have become less aggressive, suggesting selling pressure is no longer dominating. This kind of structure typically signals a market where positions are being rebalanced, with buyers absorbing available supply rather than driving immediate expansion.
The Signal Everyone Is Watching But Few Are Interpreting Correctly
The current bullish trigger comes from a weekly MACD crossover, where momentum shifts from negative to positive. Historically, these moments aligned with trend reversals and continuation phases.
- In 2025, a similar signal preceded a move from ~$125 to above $250
- Earlier cycles saw even larger expansions as trend momentum accelerated
At the same time, the RSI recovery from deeply oversold conditions suggests downside pressure has likely exhausted, a pattern often seen near macro turning points.
Similar behavior has been observed across the market, where Ether open interest surges reflect increasing trader exposure without immediate price expansion.
But here’s the key detail often overlooked:
This is not a fresh breakout environment. This is a recovery inside existing supply.
The signal reflects improving momentum, but momentum only leads to expansion when there is enough available liquidity above. Right now, that space remains limited.
Why Price Hasn’t Reacted Yet And Why That Matters
Despite the bullish setup, Solana is still trading below a key resistance cluster around $90–$96. This is not just a technical level, it represents trapped supply.
- Roughly 9.9 million SOL sits around the $90–$92 cost basis
- These holders are likely to exit at breakeven, creating overhead pressure
Recent sessions have shown price pushing upward, but failing to sustain continuation. That behavior reflects absorption rather than weakness.
Buyers are active, but they are meeting sell orders from participants who have been waiting to reduce exposure. This creates a slower process where liquidity is exchanged instead of price moving cleanly.
Liquidity is not continuous. Once nearby sell orders are absorbed, price must move higher to find the next pool of willing sellers. Until that process is complete, movement tends to stall.
When this balance eventually breaks, it often leads to sharp moves, similar to how large-scale crypto liquidations reveal how quickly leveraged positions unwind.
Markets don’t move when signals appear, they move when available supply is no longer able to cap price.
The Triangle Formation Compression Before Expansion
On the daily timeframe, Solana is forming a symmetrical triangle, but the structure is better understood as price compression within a supply zone.
- Breakout level: ~$90
- Measured move target: ~$130
- Upside potential: ~50% from current levels
But this projection only becomes relevant after acceptance above resistance.
Until then, the structure remains incomplete.
As price tightens, both buyers and sellers are forced into narrower ranges. This compression builds pressure, but the outcome depends on which side can no longer sustain its position.
Compression does not create the move. It reveals where liquidity is building.
What’s Actually Driving This Setup (Beyond Indicators)
Most analysis stops at MACD and RSI. That is surface level.
The deeper driver here is positioning reset.
Over the past few weeks:
- Momentum indicators bottomed out
- Leverage likely flushed during prior downside
- Market structure shifted from trend exhaustion to neutral compression
This aligns with rising derivatives activity, as seen in recent data showing a surge in Solana open interest signaling growing positioning pressure.
Over the past week, price behavior has reflected this shift, with repeated pushes into resistance but no sharp rejection. This suggests supply is being tested rather than aggressively defended.
This reset phase matters because it clears weaker positions and reduces forced selling. What remains is a more balanced market where price can respond more directly to new demand.
The bullish signal is not the move itself. It is confirmation that the reset phase may be complete.
The Real Risk Why This Isn’t a Guaranteed Repeat of Past Rallies
There’s a tendency to anchor on historical returns. That’s risky.
Previous rallies happened in:
- Expanding liquidity environments
- Lower supply overhead
- Stronger participation momentum
Today’s structure is different.
Even though indicators align with past cycles, market conditions are more constrained:
- Resistance is closer
- Supply concentration is heavier
- Breakout requires sustained demand, not just momentum
This creates a key distinction:
Price struggles at resistance not because buyers disappear, but because sellers are still active in size.
What Needs to Happen Next
For this setup to transition from “potential” to “trend”:
- $90–$96 must flip from resistance to support
- Buyers must absorb overhead supply, not just trigger short term spikes
- Price must hold above breakout levels, not reject immediately
If that happens, the path toward the $130 region becomes structurally valid.
If it doesn’t, this remains a range where signals appear but fail to convert into sustained movement.
Editor’s View
The market is not reacting to the signal because the signal isn’t the constraint, supply is.
What we are seeing is a controlled transfer of positions between participants. Buyers are stepping in, but they are doing so into an area where previous holders are still exiting.
The MACD crossover signals improving conditions, but it does not confirm that the path is clear.
The move begins when supply at these levels is no longer able to absorb incoming demand.
.
Disclaimer: This content is for informational purposes only and does not constitute financial advice.
Keep yourself updated with the latest crypto news with FYI Gazette
Keep yourself updated with the latest Altcoin News with FYI Gazette
 Bitcoin
  Ethereum
  Tether
  BNB
BNB  XRP
XRP  Solana
  TRON
TRON  Dogecoin
  Litecoin
  Pepe
Pepe