
Ethereum Taker Volume Surge Signals a Liquidity-Driven Move Toward $2.6K
Ethereum taker volume is not just rising, it is revealing how aggressively market participants are positioning into available liquidity. A sharp increase in taker-side activity shows that traders are no longer waiting for price to come to them. Instead, they are crossing the spread and accepting execution, which directly shapes short-term price behavior.
Over the past week, ETH has shown more directional bursts, with moves extending quickly and spending less time consolidating. This pattern often appears when taker activity dominates and resting orders are absorbed faster than they can rebuild. What looks like momentum is often a shift in how quickly liquidity is being consumed.
This is not just momentum. It is liquidity being actively targeted.
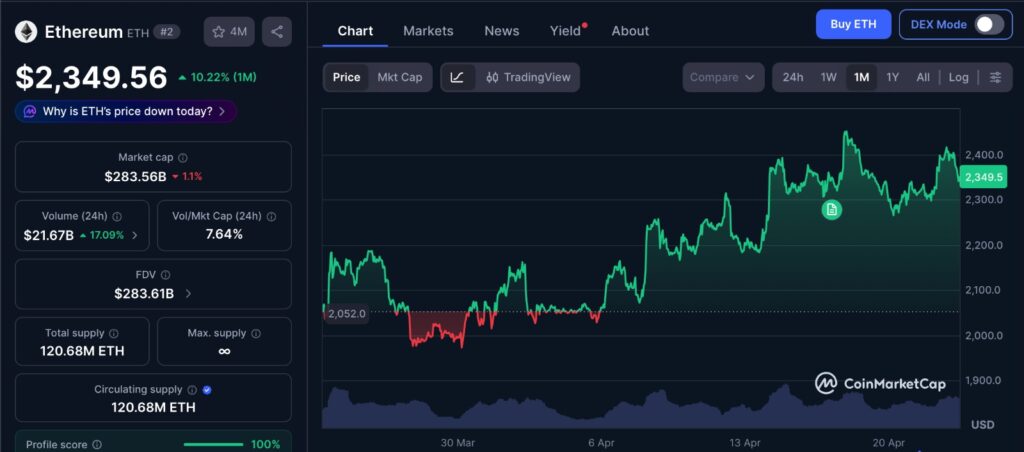
Over the past month, ETH’s price action has reflected this shift in market behavior, with periods of steady movement interrupted by sharp expansions. The chart shows how price spends less time consolidating before moving, which is often a sign of thinning liquidity rather than sustained demand. These faster transitions between levels suggest that once nearby orders are absorbed, price moves quickly to the next area where liquidity is available, reinforcing the idea that recent moves are being driven more by execution than gradual accumulation.
What Rising Taker Volume Actually Means
Taker volume reflects urgency. It represents participants who are willing to execute immediately rather than wait for better pricing. When this rises, it usually signals that traders expect conditions to change quickly or that current prices may not hold.
Takers remove liquidity from the order book, reducing the market’s ability to absorb pressure. When that buffer thins, price becomes easier to move.
Liquidity is not continuous. Once nearby orders are absorbed, price must move to the next level where meaningful orders exist. That gap between available liquidity is what allows price to accelerate without a large increase in demand.
The $2.6K Liquidity Gap: Why It Matters
Liquidity gaps are areas where the order book is thin. These zones are defined not by patterns, but by how little resistance exists between price levels.
The region near $2.6K stands out for this reason. It represents a space where price can move more freely if current activity continues. There is less opposing liquidity, orders get filled faster, and reactive positioning such as stops tends to cluster nearby.
These areas matter because they reduce friction. Price does not get pulled into them, but once it enters, it tends to move through them with less resistance.
Why This Move Is About Execution, Not Direction
Short-term price moves are often interpreted as conviction, but they are largely shaped by execution. When taker volume increases, orders are filled more aggressively and the market has less time to stabilize between moves.
The focus shifts from direction to movement. Once nearby orders are cleared, price moves quickly to find the next available liquidity.
Markets don’t move because demand increases. They move because resistance disappears at the moment it matters most.
Real Market Behavior Behind the Shift
Recent sessions have shown a clear change in behavior. Moves are developing faster, resistance is being tested with less hesitation, and entries are happening during momentum rather than after pullbacks.
This suggests participants are prioritizing execution over precision. That behavior is also visible in a large Ethereum whale taking an aggressive leveraged position, reinforcing the shift toward early and decisive positioning. Instead of waiting for ideal setups, they are acting earlier to secure exposure.
That shift compresses time. Moves that once took longer to build can now unfold quickly when liquidity conditions allow it.
The Role of Positioning and Risk
Rising taker volume often overlaps with increased leverage. This does not just amplify potential gains, it concentrates risk. Positions are opened quickly, and entry levels become crowded. This is also reflected in rising trader exposure in Ethereum derivatives, where increasing open interest shows how quickly positioning is building beneath price.
When too many participants are positioned the same way, the market becomes more sensitive to small changes. If price continues to move, positioning can support momentum. But if it slows, the same structure can unwind quickly. Recent large liquidation events across the crypto market highlight how fast leveraged positioning can reverse once stability breaks.
This is because leveraged positions depend on stability. When that stability breaks, forced exits add pressure in the opposite direction.
What This Means for Ethereum’s Current Setup
Ethereum is not simply approaching a higher price level. It is moving toward a region where execution conditions may allow faster movement, depending on how liquidity behaves.
The path toward $2.6K depends on whether taker pressure continues, whether sellers step in with size, and whether liquidity rebuilds before the move extends.
If liquidity remains limited above current levels, price can move more freely. If it strengthens, movement can slow even with strong participation.
Editor’s View: What Most Traders Miss
Most traders focus on levels and patterns, but fewer pay attention to how price actually travels between them. A liquidity gap only matters when participants are willing to push price into it.
What we are seeing now is a shift in behavior. Traders are less patient and more willing to act quickly, even at imperfect prices. That urgency reflects a willingness to take execution risk in exchange for positioning early.
Understanding that shift often matters more than focusing on any single level.
How This Affects the Broader Crypto Market
Ethereum sits at the center of market activity. When it moves through low-liquidity areas, it can draw capital from other assets and influence broader positioning.
At the same time, aggressive positioning increases sensitivity. The same conditions that allow faster upside can also lead to quicker pullbacks if liquidity returns.
Price moves fastest when the market has the least ability to slow it down.
Disclaimer: This content is for informational purposes only and does not constitute financial advice.
Keep yourself updated with the latest crypto news with FYI Gazette
 Bitcoin
  Ethereum
  Tether
  BNB
BNB  XRP
XRP  Solana
  TRON
TRON  Dogecoin
  Litecoin
  Pepe
Pepe