
Hyperliquid Price Drops Below $40 After Whale Move
Hyperliquid Price tends to reveal more about trader positioning than about the asset itself, especially when key levels start to fail. The move below $40 reflects not just selling pressure, but a shift in how participants are managing risk after a period of confidence. In leveraged markets, price often follows positioning imbalances rather than new information, which is why declines can accelerate even without a clear external trigger. This makes the current phase less about direction and more about how quickly the market absorbs forced exits and recalibrates.
Hyperliquid Price is facing renewed pressure after falling below the $40 level, signaling a shift in short term market structure. The decline follows a recent peak near $43.7, after which the asset began forming lower highs and lower lows. This change in trend has coincided with rising uncertainty among traders, especially as liquidation activity increased across long positions. While some participants remain cautious, a large whale has taken a bold stance, adding complexity to the current setup.
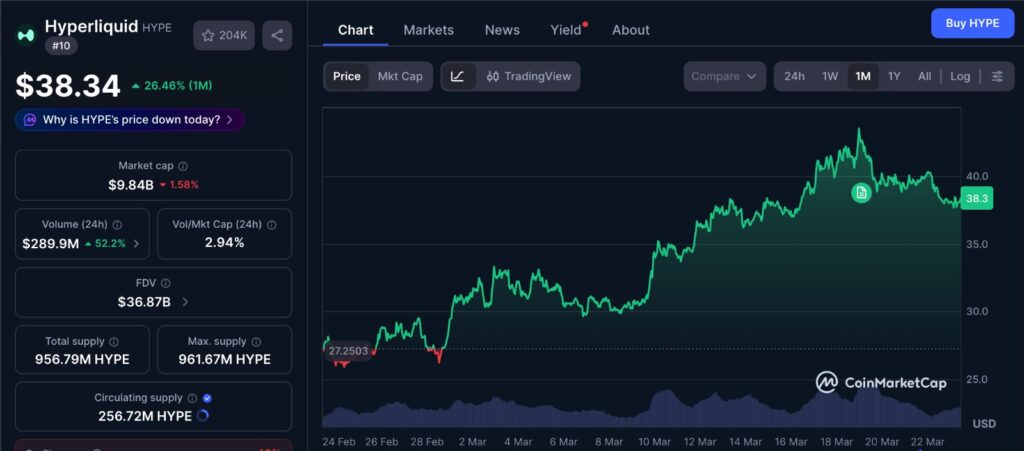
The one month price chart highlights how Hyperliquid has gradually shifted from upward momentum into a more unstable structure, with lower highs beginning to form after its recent peak. Instead of a sharp reversal, the decline appears more controlled, suggesting that selling pressure has been building steadily rather than reacting to a single event. This kind of price behavior often reflects a market where participants are slowly reducing exposure rather than exiting all at once. As a result, the chart captures a transition phase where conviction weakens before a clearer direction emerges.
Hyperliquid Price breaks below $40 support
The drop below $40 represents more than just a price movement, as this level previously acted as a key psychological and structural support. Losing it often signals weakening bullish momentum and opens the possibility of extended downside.
Recent price action shows that sellers gained control as the asset approached this zone. This led to increased liquidations, with over $2.2 million in long positions wiped out compared to roughly $282,000 in shorts. Such an imbalance highlights how aggressively bullish traders were positioned before the move, making the decline sharper once momentum shifted.
At the same time, the broader trend has turned less favorable. The formation of consecutive lower highs suggests that buyers are no longer stepping in with the same strength as before, allowing sellers to gradually dominate price direction.
$3M whale long adds new dimension
High conviction or elevated risk
Amid this weakening structure, a whale opened a long position worth around $3 million, equivalent to approximately 80,000 HYPE, using 10x leverage. This move stands out because it was initiated during a period of declining prices rather than strength.
Such positioning can indicate confidence that the market has overreacted and that a rebound may follow. Large traders often operate with a broader view and may be willing to absorb short term volatility in anticipation of future gains.
However, the timing also introduces risk. Entering a leveraged long position while the asset is breaking support levels exposes the trade to liquidation if the price continues to fall. This makes the position highly sensitive to near term movements.
Liquidation levels in focus
The presence of a large leveraged position creates a clear area of interest for the market. If Hyperliquid Price declines further, the whale’s position could be forced to close, adding additional selling pressure and accelerating the downside.
On the other hand, if the price stabilizes and moves higher, the position could contribute to upward momentum. This is especially true if short sellers are forced to exit, creating a squeeze that pushes prices higher.
Market sentiment turns cautious
Sentiment indicators suggest that the broader market is leaning bearish despite isolated signs of optimism. The long to short ratio has dropped below 1, indicating that more traders are betting on downside than upside.
However, not all platforms reflect the same sentiment. On Binance, for example, the ratio remains slightly above 1, showing that some traders still expect a potential recovery. This divergence highlights uncertainty rather than a clear directional consensus.
Momentum indicators also point to a cooling trend. The Relative Strength Index has declined to around 58, suggesting that bullish strength is fading without yet entering oversold territory. Similarly, the Aroon indicators show weakening trend intensity, reinforcing the idea that the market is transitioning rather than trending strongly in one direction.
Hyperliquid Price key levels to watch
Support zones below current price
With the loss of the $40 level, attention shifts to lower support zones. The next major areas of interest lie around $35 and $30, where previous consolidation activity occurred. These levels may act as temporary support if buying interest returns.
However, if selling pressure remains dominant, these zones could be tested quickly. In such cases, traders often look for signs of accumulation, such as reduced selling volume or price stabilization, before considering a potential reversal.
Resistance and recovery signals
On the upside, reclaiming the $40 level would be the first sign that buyers are regaining control. A move toward $42 could further strengthen the case for a short term recovery.
For a more sustained reversal, the price would need to establish higher highs and higher lows. Without this structure, any upward movement may be limited and face resistance from traders looking to exit positions after the recent decline.
Impact of leverage on Hyperliquid Price
Leverage plays a significant role in shaping price action for assets like HYPE. High leverage increases both potential returns and risks, making the market more reactive to sudden movements.
The recent liquidation imbalance shows how quickly sentiment can shift when leveraged positions are forced to close. It also highlights the importance of monitoring open interest and positioning, as these factors often influence short term volatility.
In this environment, large positions such as the $3 million whale trade can have an outsized impact. Whether it leads to a liquidation event or a successful rebound, the outcome is likely to shape the next phase of market behavior.
Editor’s View: Why traders get caught at key levels
What stands out here is how quickly positioning flipped once the $40 level gave way. Many traders tend to anchor their bias around round numbers, which creates clusters of leveraged positions that look stable until they are not. When that level breaks, the reaction is less about fundamentals and more about forced adjustments, as liquidations begin to drive price instead of conviction. The whale’s long entry, in that context, reflects a different approach, one that leans on liquidity dynamics rather than reacting to the immediate trend.
What comes next for Hyperliquid Price
The current state of Hyperliquid Price reflects a balance between weakening momentum and potential opportunistic positioning. The breakdown below $40 has shifted sentiment, but the presence of a large leveraged long position introduces the possibility of a sharp counter move.
Ultimately, the next direction will likely depend on how price reacts around key levels and how leveraged positions evolve. Until a clearer structure forms, the market remains sensitive to both downside risks and sudden reversals, making it a critical phase for traders to watch closely.
Disclaimer: This content is for informational purposes only and does not constitute financial advice.
Keep yourself updated with the latest crypto news with FYI Gazette
Read more about Memecoins with FYI Gazette
Keep yourself updated with the latest Altcoin News with FYI Gazette
 Bitcoin
  Ethereum
  Tether
  BNB
BNB  XRP
XRP  Solana
  TRON
TRON  Dogecoin
  Litecoin
  Pepe
Pepe