

MemeCore Slides 15%: Why This Support Level Could Decide M’s Next Move
MemeCore is entering a phase where price movement matters less than where buyers choose to defend. After a sharp decline, the token is now approaching a level that has previously shaped its direction. What happens here is not just about recovery or further downside, but about whether market participants are still willing to transact at these prices.
At this stage, structure matters more than momentum.
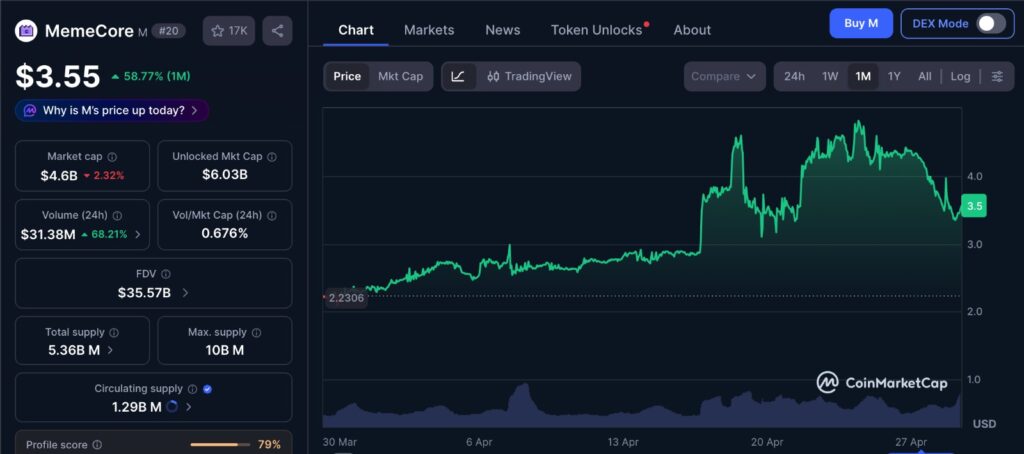
The 1-month price structure shows how MemeCore transitioned from expansion into a controlled pullback, with recent sessions reflecting slower downside rather than aggressive selling. This kind of movement often indicates that the market is not in panic, but in a phase where buyers and sellers are gradually rebalancing. The current price region stands out as an area where interaction has increased, making it a key zone to watch for whether demand is strong enough to absorb supply or if price needs to move further to find it.
The Pullback Is Not Random – It Reflects Positioning Shift
MemeCore’s recent decline follows a familiar pattern across volatile assets. After a strong upward phase, the market begins to cool as early participants lock in gains while newer buyers hesitate to commit.
This is not just a price correction. It reflects a shift in positioning, where early entrants distribute into strength and late buyers are left reacting rather than influencing direction.
As markets transition from expansion to consolidation, focus shifts from chasing highs to defending key zones. The current pullback fits that transition, showing a slowdown in aggressive buying rather than a complete loss of interest.
The Importance of the Current Support Zone
The level MemeCore is now testing marks an area where buyers previously stepped in with enough conviction to reverse downside pressure.
This matters because support is not a fixed line. It is an area where buy orders are expected to absorb incoming selling.
If buyers absorb that flow, price stabilizes. If they fail, price is forced lower to find the next zone where demand is strong enough to respond.
This is what the market is testing right now. Not the level itself, but the ability of participants to defend it.
Liquidity Behavior: What the Market Is Actually Testing
What matters now is how liquidity behaves around this level.
In simple terms, the market is asking:
- Can buyers absorb the current selling pressure?
- Or will selling continue to push price lower?
Recent sessions have shown price drifting lower without sharp volatility spikes, suggesting selling has been steady while buy-side interest has thinned. Large liquidation cascades show how quickly downside can accelerate once support weakens, as seen during recent crypto liquidations where over $820M in positions were cleared.
This is where execution becomes critical. Price holds only if incoming sell orders are matched by active buyers. This kind of interaction is often driven by aggressive order flow, where participants execute immediately rather than wait, similar to recent spikes in Ethereum taker volume. Once those buy orders are consumed, there is little to prevent price from moving lower.
Liquidity is not continuous. When nearby bids are absorbed, price must move to the next level where meaningful demand exists.
Price does not hold because buyers are strong. It holds because sellers fail to push it lower.
Why This Level Matters More Than the Previous Highs
While attention often stays on resistance and recent highs, support determines whether a trend can continue.
A failed breakout can be recovered.
A lost support level is harder to reclaim.
If this zone holds:
- It confirms that buyers are still willing to engage at these levels
- It creates a base where demand can build again
- It traps late sellers who entered after the drop
If it fails:
- It shows that selling pressure is not being absorbed
- It forces price to search for lower demand zones
- It shifts behavior from participation to caution
This is why price slows around such levels. It reflects a balance test between incoming supply and available demand.
Derivatives and Sentiment: The Hidden Layer
Behind the price movement, derivatives activity shows how traders are adjusting exposure. These shifts are often visible through changes in positioning, as reflected in recent movements in Ether open interest where traders adjusted exposure as conditions evolved.
In phases like this, positions are often reduced as traders step back and risk is taken off the table.
This changes how price behaves:
Similar patterns have appeared in assets like Solana, where Solana open interest showed how quickly traders can reposition during uncertain phases.
- Lower open interest reduces sudden volatility spikes
- Fewer leveraged positions mean fewer forced liquidations
- Price becomes more dependent on actual spot demand
As leverage declines, price moves become less reactive and more controlled. Without forced liquidations driving momentum, price will only move meaningfully when real buying or selling pressure builds.
This often makes support tests slower but more decisive.
Editor’s View
What stands out here is not the drop itself, but how controlled it has been. The market has not shown signs of panic selling, which typically defines deeper corrections.
Instead, this looks more like a rotation phase, where early profits are being redistributed rather than fully exited.
Markets that slow down like this are not necessarily weak. They are shifting from momentum-driven moves to participation-driven ones, where conviction matters more than speed.
If buyers engage here, it reflects willingness to transact at current levels rather than a short-term reaction.
What This Means for the Broader Crypto Market
Meme coins often exaggerate market behavior, but they also reveal underlying sentiment faster than larger assets.
When a memecoin like MemeCore:
- Holds support, it shows participants are still willing to take risk
- Breaks support, it shows demand is no longer absorbing supply
This is why smaller assets can act as early indicators.
If MemeCore stabilizes here, it suggests participation remains intact. If not, it reflects tightening liquidity where capital becomes more selective.
Conclusion
MemeCore’s recent 15% drop is not just a decline. It is a test of whether demand at this level can absorb ongoing selling.
Price will not react because the level exists. It will move when the available liquidity at this level is no longer sufficient to handle incoming orders, forcing the market to adjust to the next area where balance can be found.
Disclaimer: This content is for informational purposes only and does not constitute financial advice.
Keep yourself updated with the latest crypto news with FYI Gazette
 Bitcoin
  Ethereum
  Tether
  BNB
BNB  XRP
XRP  Solana
  TRON
TRON  Dogecoin
  Litecoin
  Pepe
Pepe