

Ethereum $3K Price Target Remains in Play as Buyers Defend Key Support
Ethereum is entering May with a setup that looks stronger than price action alone suggests. While ETH has pulled back from recent highs above $2,460, the broader structure has not broken down. Instead, the market is showing controlled consolidation, with buyers still active near important support zones.
The $3,000 Ethereum price target is not based on optimism alone. It is supported by technical structure, realized price support, and buyer activity in the spot market. These signals do not guarantee an immediate move higher, but they show that Ethereum’s recovery attempt remains intact.
Recent sessions have shown a market that is not aggressively chasing upside, but also not abandoning support when price weakens. That balance matters because Ethereum’s next move depends less on one breakout attempt and more on whether buyers can continue absorbing supply near key levels.
Ethereum’s Chart Structure Still Supports a Recovery Setup
Ethereum has already recovered sharply from its February low below $1,800, and that rebound has changed the structure of the market. Instead of continuing to print weaker lows, ETH has been forming a more constructive base, with buyers stepping in before the market fully breaks down.
The main technical setup being watched is a bull flag on the daily chart. The important point is not the pattern itself, but what it shows underneath. Price is compressing after a sharp rebound, which means the market is testing whether recent buyers can hold their positions without forcing a deeper reset.
For Ethereum, the key level sits near the upper boundary of the current range. A clean break above the $2,350 to $2,400 region would matter because it would show that buyers are no longer just defending support. They would be pushing through the area where sellers have recently appeared.
That is why the $3,000 target remains relevant. The measured move from the current chart structure points toward that area if ETH can confirm a breakout. However, confirmation matters more than the target itself. Without sustained demand above resistance, the setup remains potential rather than proof.
Targets do not move markets. Participation does.
A bullish chart pattern does not mean price must rise. It means the market is showing conditions where an upside move becomes possible if buyers continue to control the structure.
ETH Is Still Holding a Critical Support Zone
The most important part of Ethereum’s current setup is not the $3,000 target. It is the support range below current price.
ETH has been consolidating near the $2,000 to $2,200 area, which has become a key zone for market structure. This region matters because it is not just a random level on the chart. It aligns with moving average support and also overlaps with an area where a large amount of ETH was previously acquired.
According to the data referenced in the source, around 7.4 million ETH was acquired between $1,980 and $2,178. That makes the zone important because investors who bought there may defend their positions if price revisits the area. When many holders have similar entry levels, that zone can become a place where selling slows and buyers become more willing to step in.
This matters because support is not created by a line on a chart. It forms when enough participants see value at lower prices and sellers struggle to push through that demand. Supply-side flows also matter, especially after the Ethereum Foundation unstaked 17K ETH, because large ETH movements can influence how traders judge support strength.
Liquidity is not always evenly spread. Once nearby sell orders are absorbed, price has to move toward the next area where enough buyers or sellers are willing to trade.
This does not mean the level cannot fail. Support zones are not walls. They are areas where market participants have previously shown interest. If buyers remain active there, the structure can hold. If selling overwhelms the zone, the bullish setup weakens.
For now, Ethereum’s ability to stay above this range keeps the recovery scenario intact. As long as ETH avoids a deeper breakdown below this support base, the market can continue treating the recent pullback as consolidation rather than full trend failure.
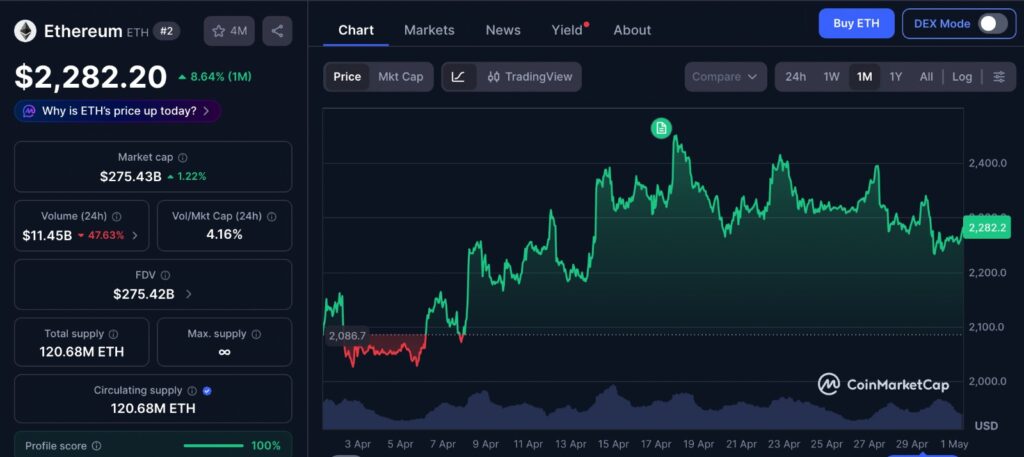
The current Ethereum price chart should show how ETH is behaving near its recent support and resistance zones. A one-month ETH chart from CoinMarketCap would help readers compare the recent pullback with the broader recovery structure. This matters because the $3,000 discussion depends less on a single daily move and more on whether ETH can keep holding support while attempting to reclaim resistance.
Spot Buyer Activity Is the Strongest Part of the Argument
The strongest signal behind Ethereum’s current setup comes from spot market behavior.
Ether’s 90-day spot taker cumulative volume delta, or CVD, has remained positive after flipping in March. This matters because CVD helps show whether aggressive buyers or sellers are dominating market execution. When CVD is positive, it suggests that taker buy volume is stronger than taker sell volume over the measured period.
In simple terms, buyers are not just waiting passively with limit orders. They are actively entering the market.
That matters because price recoveries built only on leverage can be fragile. If a move is driven mostly by futures speculation, it can unwind quickly when funding changes or liquidations begin. But when spot buyers are also active, the structure becomes more durable because real demand is present beneath the move.
The source also noted that Ether’s taker buy volume jumped above $1 billion during the recent move below $2,300. That suggests some traders used the dip to increase exposure rather than exit the market. This also connects with the recent Ethereum taker volume surge, where stronger buy-side execution showed how quickly ETH can react when liquidity starts shifting toward buyers.
This is one reason Ethereum’s pullback has not invalidated the bullish case. A weak market usually sees buyers disappear when price drops. In ETH’s case, the dip appears to have attracted fresh interest.
Strong markets are not defined by avoiding pullbacks. They are defined by what buyers do when those pullbacks arrive.
Why $3,000 Is Still Possible, But Not Guaranteed
The path toward $3,000 depends on three conditions.
First, Ethereum needs to keep defending the $2,000 to $2,200 support range. If that zone remains intact, the market structure stays constructive.
Second, ETH needs to reclaim resistance around $2,350 to $2,400 with enough volume to show that buyers are in control. A weak move above resistance followed by rejection would not carry the same weight as a clean breakout. That is why rising trader exposure matters, especially after Ether open interest surged and showed that positioning around ETH has become more active.
Third, spot demand needs to remain positive. If CVD weakens and buyers stop absorbing dips, the recovery case becomes less convincing.
This is why the $3,000 price target should be viewed as a structural target, not a guaranteed forecast. The setup is there, but it still requires confirmation.
Ethereum’s current market is not showing blind euphoria. It is showing selective demand. Buyers are active, but they are still being tested. Resistance remains in place, and ETH still needs to prove that it can move beyond consolidation.
Editor’s View
Ethereum’s current setup is interesting because the market is not behaving like it is fully confident, but it is also not behaving like it has given up. That middle zone is where structure matters most. When price pulls back and buyers still respond, it often shows that participants are watching value rather than chasing momentum.
The $3,000 target will attract attention, but the better signal is whether ETH continues to hold its support base while spot buyers remain active. Targets create headlines, but support behavior reveals conviction. That same idea was visible in the recent Ethereum whale long ETH structure signal, where large-position behavior added another layer to the market’s support-focused setup.
For now, the market is not confirming a breakout. It is confirming that buyers are still present.
Final Thoughts
Ethereum’s $3,000 price target remains in play because the market has not lost the structure that supports it. The chart remains constructive, the $2,000 to $2,200 support zone still matters, and spot buyer activity has not disappeared during the pullback.
This does not mean ETH will move straight to $3,000. It means the recovery setup has not been invalidated.
The next major signal will come from how Ethereum behaves near resistance. If ETH can reclaim the $2,350 to $2,400 zone with strong participation, the $3,000 target becomes more realistic. If buyers weaken there, the market may remain trapped in consolidation.
For now, Ethereum is still a market where support is being defended, but resistance has not yet been taken. The move begins when buyers absorb enough supply that sellers can no longer control the range.
Disclaimer: This content is for informational purposes only and does not constitute financial advice.
Keep yourself updated with the latest crypto news with FYI Gazette
Keep yourself updated with the latest Altcoin News with FYI Gazette
 Bitcoin
  Ethereum
  Tether
  BNB
BNB  XRP
XRP  Solana
  TRON
TRON  Dogecoin
  Litecoin
  Pepe
Pepe