
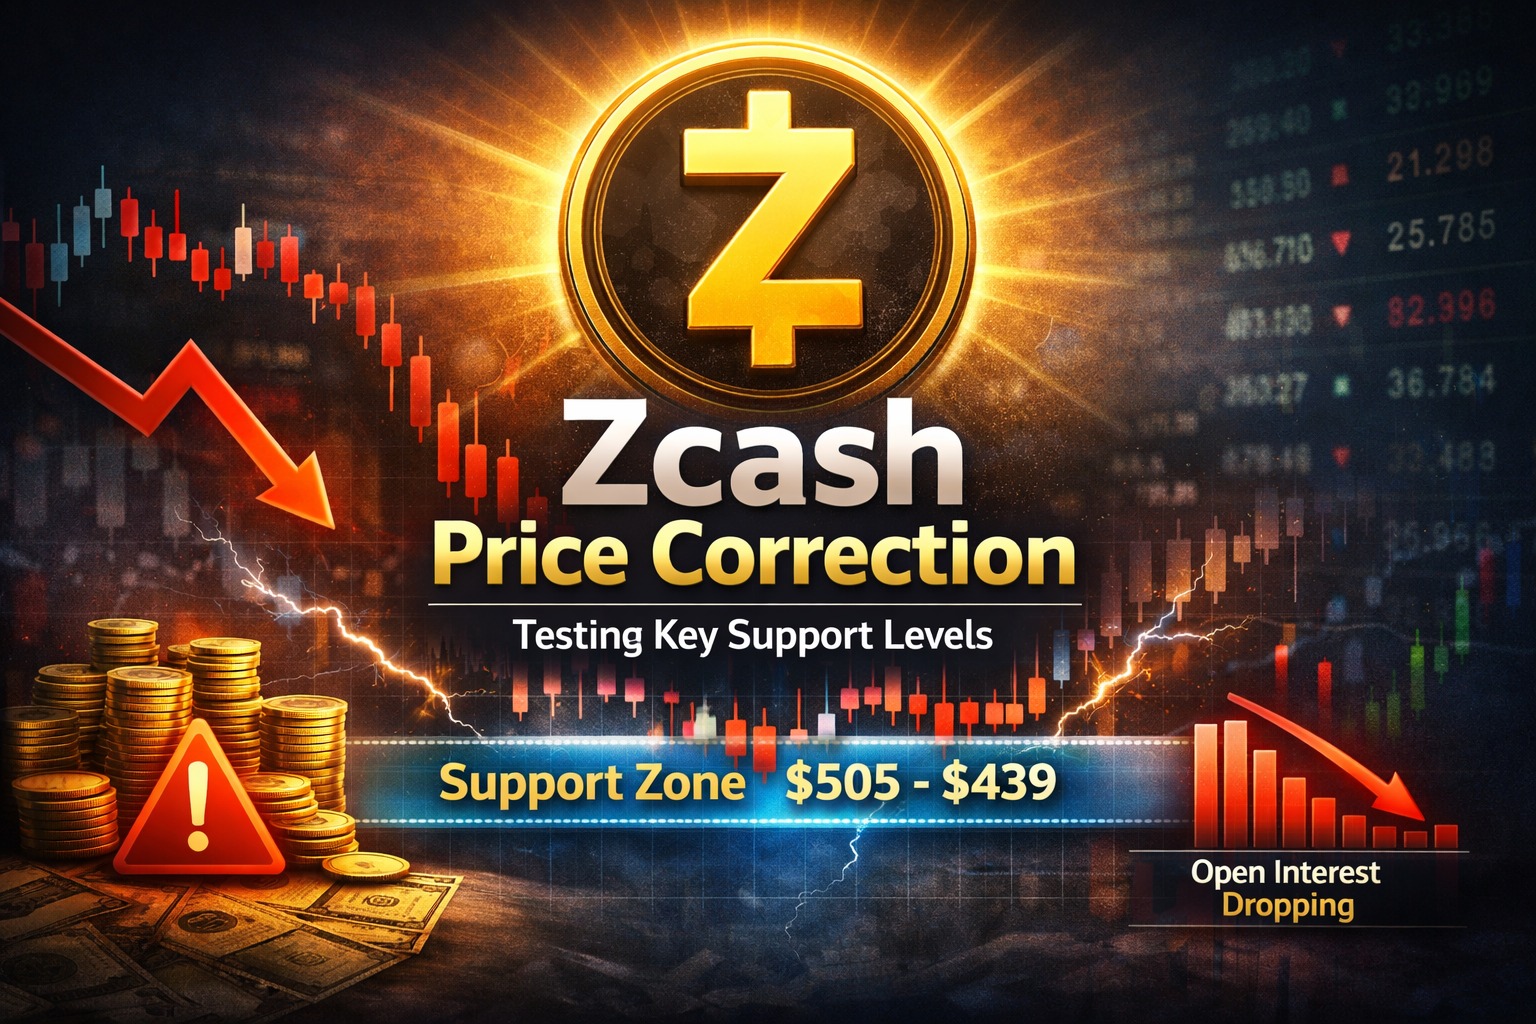
Zcash Price Correction Tests Key Support as Leverage Unwinds
The Zcash price correction has become one of the more important altcoin setups to watch after ZEC pulled back sharply from its recent rally.
ZEC dropped more than 10% over the past 24 hours, cooling a strong upside move that had pushed the token into a much hotter trading zone. This pullback comes after a strong move in ZEC, which had recently gained attention as Zcash price surged on renewed privacy coin demand. At first glance, that kind of decline can look like a major warning sign. But the deeper structure suggests the move may be more about leverage unwinding than a complete trend failure.
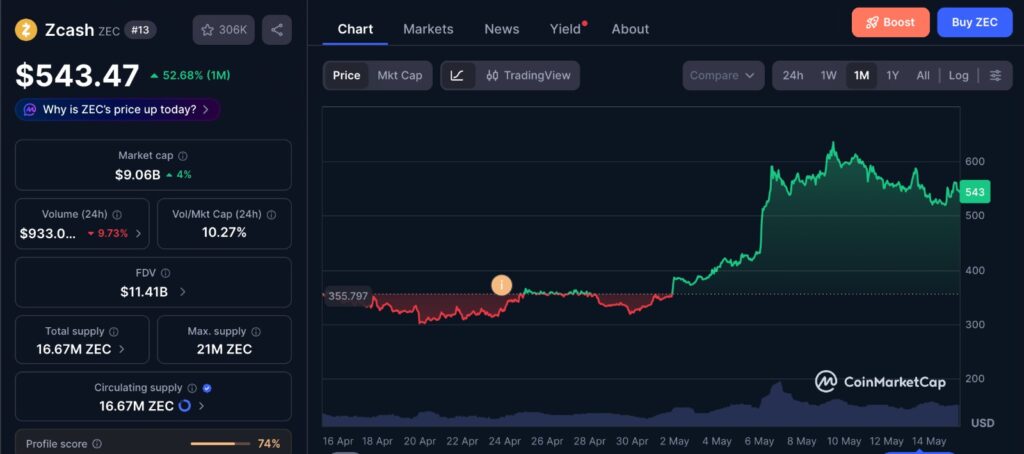
The one-month Zcash price chart shows how quickly ZEC moved from strong upside momentum into a sharper cooling phase. This makes the current support test more important because the market is no longer reacting to a slow trend, but to a fast rally that is now being tested by leverage unwinding and weaker short-term positioning. If the chart begins to show slower selling near the $505 to $439 range, it would suggest buyers are starting to absorb pressure instead of letting price search for lower demand.
That distinction matters.
When a coin rallies quickly, traders often chase the move through futures and leveraged positions. This can make the upside look stronger than it really is because part of the move is being driven by fast positioning, not only steady spot demand. Once price slows, those positions become fragile. A sharp pullback can then force long traders out of the market, adding more sell pressure.
Recent sessions have shown that ZEC’s reaction is less about one large red candle and more about whether real demand remains after leveraged momentum has been cleared.
The correction is not just about price falling. It is about how positioning, liquidations, and open interest are changing together. Those signals help explain whether sellers are gaining control or whether the market is simply removing excess leverage before choosing its next direction.
Why The Zcash Price Correction Matters Now
The Zcash price correction comes after a strong breakout phase, which makes the current pullback more important than a normal intraday decline.
A fast rally often creates two types of buyers. The first group includes spot buyers who are willing to hold through volatility. The second group includes short-term leveraged traders who enter late and depend on continued upside momentum.
The second group is usually weaker.
When momentum slows, leveraged longs can quickly become forced sellers. That is why liquidations matter in this setup. More than $7.84 million in long positions were wiped out during the latest 24-hour period, showing that many bullish traders were caught on the wrong side of the move. That fits a broader market pattern where crypto liquidations have shown how quickly leverage can turn into forced selling when momentum slows.
This does not automatically mean the broader structure has collapsed. Forced liquidation events can happen during corrections inside larger uptrends, especially after a sharp rally attracts crowded positioning. The key is whether price stabilizes after leverage exits or whether sellers continue to push through major support.
This matters because leverage can create temporary demand on the way up and forced supply on the way down. When that forced supply reaches a thinner support area, price can move quickly until it finds enough real buyers to absorb it.
For ZEC, that test now sits near the $505 to $439 support range.
ZEC Support Range Becomes The Main Decision Area
The $505 to $439 area now stands out as the most important range for ZEC.
This zone matters because it represents the area where buyers may need to step back in if the recent rally is going to remain intact. If buyers absorb forced selling inside this range, price can stabilize because the weakest positions have already been cleared. If they fail, price may need to move lower to find the next area where demand is strong enough to respond.
That is why this area should not be judged by one candle alone.
A support zone becomes meaningful when price reacts to it with real demand. Traders should watch whether ZEC shows buyer absorption, slower selling pressure, and reduced liquidation risk near this range. A weak bounce with no follow-through would not carry the same weight as a firm reaction backed by stronger spot demand.
This is where execution becomes important. Serious buyers do not need price to instantly return to recent highs. They need to show that sell pressure can be absorbed without the market breaking lower. That kind of reaction says more than a sudden bounce because it shows buyers are defending value instead of only chasing momentum.
The market does not need ZEC to immediately reclaim its highs. It needs proof that buyers are still willing to step in after excess leverage has been removed.
The real test is not whether ZEC reaches support. It is whether buyers treat that support as value.
Open Interest Drop Shows Traders Are Reducing Exposure
One of the most important signals in this setup is the sharp decline in open interest.
ZEC open interest reportedly dropped by more than $500 million over the past five days. That shows traders have been closing positions instead of adding fresh exposure. This is very different from a market where open interest rises while price falls.
The difference is important. When price falls and open interest rises, it can suggest fresh short positions are entering the market. That often points to stronger bearish conviction. But when price falls while open interest drops, the move is more likely being driven by position unwinding, liquidations, or traders reducing risk.
That is what makes the current ZEC setup more balanced.
Sellers are clearly applying pressure, but the open interest decline suggests the market is not necessarily seeing a wave of new bearish expansion. Instead, traders appear to be stepping back after a crowded rally. This can create short-term volatility, but it can also make the market cleaner once forced positions are removed.
A healthier structure often begins when excessive leverage leaves first.
That does not make the pullback bullish by itself. It simply means the decline may be less about fresh conviction from sellers and more about traders reducing risk after the rally became crowded. The next signal will come from whether new demand appears once forced selling cools. This is similar to how Bitcoin funding rates have reflected cautious leverage across the wider market, where traders remain active but less willing to chase risk aggressively.
Short Positioning Rises, But Conviction Looks Mixed
Another important detail is the rise in short positioning.
Roughly 57% of positions turned short during the correction phase. On the surface, that looks bearish. More traders are leaning against ZEC, and that can weigh on sentiment. However, short positioning needs to be viewed alongside open interest and market participation.
If shorts increase while open interest expands, it usually signals growing bearish confidence. But if shorts increase while participation cools, the message is less clear. It may show that traders are reacting to the decline rather than building a strong directional view.
That creates a more fragile bearish setup.
If ZEC continues to lose support, short sellers may gain more control. But if buyers defend the $505 to $439 range and price starts to stabilize, crowded short positioning can create the conditions for a sharper rebound. In that case, bearish traders may be forced to reduce exposure, adding fuel to a recovery move.
This is why the next reaction near support matters more than the 10% drop itself.
The decline shows pressure. The support reaction will show whether that pressure has control.
What Traders Should Watch Next
For now, ZEC is no longer trading in clean expansion mode. The rally has cooled, leverage has been reduced, and traders are reassessing risk.
The most important signal to watch is whether the $505 to $439 range holds. A controlled reaction inside that zone would support the idea that the correction is still part of a broader reset. A breakdown below it would increase the risk of a deeper pullback and could force the market to search for lower liquidity.
Traders should also watch open interest closely. If open interest begins rising again while price stabilizes, it could suggest new positioning is entering the market. But if open interest keeps falling and price keeps sliding, that would show continued risk reduction rather than renewed confidence.
Liquidations are another key factor. A slowdown in forced selling would help ZEC build a stronger base. Continued liquidation pressure, however, could keep price unstable even near support.
The cleanest constructive case would involve ZEC defending support, liquidations cooling, and buyers returning without excessive leverage. The weaker case would involve price losing the support range while open interest and sentiment remain fragile.
For now, the market is not asking whether ZEC can immediately restart its rally. It is asking whether the recent move had enough real demand behind it to survive after leverage has been cleared.
Editor’s View
The Zcash price correction should not be ignored, but it also should not be treated as a confirmed breakdown yet.
The move still looks more like a leverage unwind after a strong rally than a full structural failure. Long liquidations, falling open interest, and rising short positioning all show that traders are becoming more cautious. But caution is not the same as bearish control.
The $505 to $439 range is now the level that matters most. If buyers defend it with real demand, ZEC may still stabilize after the reset. If that range fails, the market could shift from a controlled pullback into a deeper correction phase.
This is the kind of setup where the headline drop can be misleading. A 10% decline gets attention, but the better signal is how the market behaves after forced leverage has already been cleared.
For now, the better reading is simple: ZEC has lost momentum, but it has not lost the entire structure yet.
The next move will not be defined by one bounce or one red candle. It will be defined by whether real demand can absorb forced selling inside the $505 to $439 support range.
Disclaimer: This content is for informational purposes only and does not constitute financial advice.
Read more about Memecoins with FYI Gazette
Keep yourself updated with the latest Altcoin News with FYI Gazette
 Bitcoin
  Ethereum
  Tether
  BNB
BNB  XRP
XRP  Solana
  TRON
TRON  Dogecoin
  Litecoin
  Pepe
Pepe