

Solana Open Interest Drop Puts $68 Back in Focus as Futures Traders Cut Risk
Solana open interest has dropped sharply in May, and that decline is changing how traders read the next major SOL price move.
At first glance, Solana’s weakness looks like another altcoin pullback. Price is struggling near the lower side of its recent range, momentum has faded, and traders are watching whether the $80 area can continue to hold. But the more important signal is not only where SOL is trading. It is whether real spot demand can absorb pressure now that futures traders have stepped back.
Reported futures data showed Solana open interest falling from around $2.75 billion on May 11 to about $1.90 billion, a decline of roughly 30%. That is a major reset in speculative positioning. In simple terms, fewer traders are willing to keep leveraged SOL exposure open while price sits near a critical support zone.
This does not automatically mean Solana is entering a deeper collapse. But it does show that confidence in the futures market has weakened. When price and open interest fall together, traders are often closing positions, reducing risk, or getting forced out of crowded setups. The market is not becoming more aggressively bearish. It is becoming less willing to carry risk.
Recent sessions have shown SOL struggling to reclaim higher levels while leveraged participation continues to shrink, making the current support area more important than a normal range low.
Markets do not weaken only when sellers appear. They weaken when buyers stop absorbing pressure at the same levels.
Solana Open Interest Shows Traders Are Stepping Back
The Solana open interest drop matters because futures markets often reveal how aggressive traders really are.
When price falls and open interest rises, it can suggest new short positions are entering the market or that traders are building leveraged exposure into weakness. That kind of setup can create squeeze risk if price reverses. But Solana’s current structure looks different. Open interest has declined while price has weakened, which suggests traders are cutting exposure instead of adding risk.
This marks a clear shift from earlier conditions, when Solana open interest had previously shown aggressive $100 positioning before the latest reduction in leveraged exposure.
That points to caution rather than conviction.
Funding rates have also remained close to neutral. This means traders are not showing an extreme bullish or bearish imbalance through perpetual futures. In other words, the market is weak, but it is not yet showing the kind of one-sided positioning that often creates a clean contrarian setup.
This is why the current SOL structure is more complicated than a simple bullish or bearish read. Leverage has cooled, futures traders have stepped back, and price is now sitting near an area where spot demand must prove whether it can absorb selling pressure.
A neutral funding rate does not mean the market is healthy. It only means traders are not paying aggressively to hold one side of the trade. The real test is whether buyers still appear when price reaches the lower end of the range.
Futures Selling Weakens the Solana Price Structure
The bigger concern for Solana is that futures activity has shown stronger sell-side pressure through May.
Futures cumulative volume delta, which tracks whether buyers or sellers are more aggressive over time, reportedly fell to a yearly low. That suggests sellers have been more active in derivatives markets, even as open interest has declined. This combination can create a difficult environment for price because the market is losing leveraged participation while still facing active selling.
Solana is not just losing speculative participation. It is also dealing with pressure from traders using futures markets to reduce exposure or position for further downside.
That pressure does not always produce a straight-line breakdown. Markets often pause, bounce, and retest important levels before choosing direction. But it does weaken the quality of the range. If every move toward resistance meets selling while leverage continues to drain, the market starts to feel less like accumulation and more like distribution.
This matters because rallies need willing follow-through. When traders are reducing exposure, rebounds can fade faster because fewer participants are prepared to chase strength.
The $80 region is now important because it sits near the lower end of the recent structure. If buyers fail to absorb selling near $80, price does not need a new bearish catalyst. It simply moves toward the next area where demand is strong enough to respond.
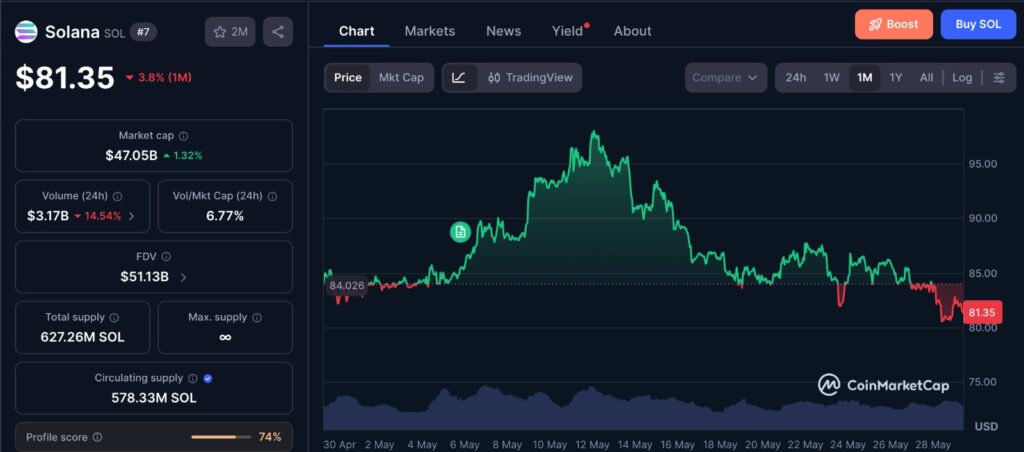
The one-month SOL price chart shows why the current setup is more about structure than a single price move. SOL has struggled to rebuild momentum after repeated weakness near the lower end of its recent range, while the $80 area remains the key zone where buyers need to show absorption. If demand continues to fade around this level, the chart helps explain why traders are watching the $68 region as the next major liquidity area rather than treating it as a guaranteed target.
Why the $68 SOL Level Matters Now
The $68 level matters because it is close to Solana’s yearly low and appears to sit near a major pocket of long-side liquidity.
Liquidity zones matter because markets often move toward areas where leveraged positions are vulnerable. If a large amount of long leverage is sitting below the current price, a breakdown can trigger stop losses, liquidations, and forced selling. That can accelerate a move even when the original selling pressure is not extreme. The same mechanism has appeared across the wider market, where recent crypto liquidations showed how forced selling can accelerate market moves once leveraged positions begin to unwind.
For Solana, the risk is not simply that price falls below $80. The real risk is that a break below $80 turns into a liquidity-driven move toward the $68 region.
This is where traders need to separate price levels from market structure. A support level can look strong until it is tested too many times. Each retest can absorb more available buy orders. If sellers remain active and buyers become less aggressive, the level becomes weaker over time.
Liquidity is not continuous. Once nearby buy orders are absorbed, price often has to move lower to find the next area where meaningful demand is waiting.
Support does not fail all at once. It often weakens quietly as available buyers get used up.
That is also why execution matters near visible support. Once traders see the same level being tested repeatedly, some buyers wait lower instead of stepping in early, while sellers become more confident pushing price into the next liquidity pocket.
The $68 area is not guaranteed to be hit, and it should not be treated as a fixed price target. It is better understood as a liquidity zone that becomes more relevant if SOL loses the lower boundary of its recent range.
Spot Demand Is the One Stabilizing Signal
The bearish part of the Solana setup is clear: open interest is down, futures selling has increased, and price is near a vulnerable range low.
But the spot market adds an important counterpoint.
Reported spot activity has shown more resilience than futures activity, with spot CVD improving since March. That suggests some buyers have continued to absorb SOL on spot exchanges even as leveraged traders cut risk. This difference matters because spot buying is generally more stable than futures speculation. Spot buyers are not forced out in the same way leveraged traders are.
This creates a split market.
On one side, futures traders are reducing exposure and showing weaker risk appetite. On the other side, spot buyers appear to be providing some absorption. That does not make the chart bullish by itself, but it does reduce the idea that the move is pure panic selling. That also fits with the broader pattern seen when Solana’s earlier bullish signal failed to produce a clean price move, showing that isolated signals matter less when participation remains weak.
The better interpretation is that Solana is facing a confidence test. Speculative demand has cooled, but spot demand has not fully disappeared. If spot buyers continue to absorb supply near the range low, SOL may avoid a deeper liquidity move. If that absorption weakens, the $68 area becomes much more relevant.
This is the key difference between a normal pullback and a more fragile market. In a normal pullback, buyers absorb selling and rebuild control. In a fragile market, buyers only slow the decline while sellers continue to set the tone.
Solana’s Problem Is Not Just Price, It Is Participation
The most important Solana signal right now is participation.
Strong uptrends usually need active spot demand, supportive derivatives positioning, and enough liquidity to sustain higher prices. Solana currently does not have that clean combination. Futures traders are stepping back, funding is neutral, and price is still struggling near support.
That does not mean SOL has no buyers. It means the market lacks aggressive confirmation.
This is often how weaker phases develop in large-cap altcoins. Price does not always collapse immediately. Instead, rallies become smaller, support gets tested repeatedly, and traders slowly reduce exposure. By the time the breakdown becomes obvious, much of the positioning shift has already happened.
That is why the open interest decline deserves attention. It shows that traders are not simply waiting for a breakout. Many have already lowered risk.
The next strong signal may not come from price alone. It may come from whether participation returns when SOL attempts to recover. If price bounces but open interest and spot demand remain weak, the move could look more like relief than renewed strength.
Editor’s View: The $68 Risk Is About Liquidity, Not Fear
The $68 Solana level should not be viewed as a random bearish target. It is more useful to see it as a liquidity zone.
When leverage builds around visible support zones, price often becomes sensitive to forced flows. If SOL breaks below $80 and long positions begin to unwind, the move toward $68 could happen because of market mechanics rather than a sudden change in Solana’s long-term narrative.
That distinction matters.
A liquidity-driven move can be sharp, but it does not always mean the asset is fundamentally broken. It means the market structure was vulnerable. For Solana, the next phase depends on whether spot buyers can keep absorbing supply while futures traders remain cautious.
If they can, the market may stabilize and rebuild from a cleaner base. If they cannot, the drop in open interest may be remembered as an early warning that speculative support had already left before price made its next move.
The important point is not whether Solana looks weak today. The important point is whether enough real demand appears before the market is forced to search lower for the next strong buyer.
Final Thoughts
Solana open interest has fallen sharply, making the current SOL setup one of the more important large-cap altcoin structures to watch.
The market is not showing extreme bearish funding, so the setup is not yet a simple crowded-short squeeze. Instead, it is showing a quieter warning: leveraged traders are reducing risk while price sits near a key support zone.
The $80 area remains the immediate level to watch because it is where spot demand must prove itself. A strong defense would show that buyers are still absorbing futures-led weakness. A clean loss of that zone would make the $68 region more relevant, especially if long-side liquidity begins to unwind.
For now, Solana is not only fighting a price level. It is testing whether real demand is strong enough to absorb pressure after futures traders have stepped back. The move begins when the market can no longer absorb selling near $80, forcing price to search lower for real demand.
Disclaimer: This content is for informational purposes only and does not constitute financial advice.
Read more about Memecoins with FYI Gazette
Keep yourself updated with the latest Altcoin News with FYI Gazette
 Bitcoin
  Ethereum
  Tether
  BNB
BNB  XRP
XRP  Solana
  TRON
TRON  Dogecoin
  Litecoin
  Pepe
Pepe