
Bitcoin 200-Week SMA Becomes Key After $600M Long Liquidation Flush
Bitcoin 200-week SMA support has moved back into focus after a sharp liquidation flush pushed BTC toward the lower end of its long-term cycle structure.
Bitcoin briefly dropped near the $61,300 region before rebounding back above $64,000, while more than $600 million in long positions were wiped out. But the real story is not only the liquidation event. It is whether Bitcoin can still defend the 200-week simple moving average, a long-term trend marker that often carries more weight than ordinary support.
Recent sessions have shown Bitcoin losing upside momentum before sliding into a deeper structural test. That makes the reaction near the 200-week SMA more important than the size of the rebound.
The 200-week SMA is not a short-term trading line. It is a cycle-level reference point that traders often use to judge whether Bitcoin is still holding its broader market structure. When BTC trades near this area, the market is no longer only reacting to short-term volatility. It is testing whether the long-term trend still has real buyer support.
Unlike horizontal support levels, the 200-week SMA reflects Bitcoin’s long-term trend structure across multiple cycles. That is why losing it can change how traders interpret the entire decline.
Bitcoin 200-Week SMA Turns Into the Real Test
The Bitcoin 200-week SMA was sitting near $61,800 as BTC tested the lower part of its recent range. That matters because the latest decline brought price close to a long-term zone that has historically been watched during major cycle stress.
This is why the current setup is different from a normal pullback.
A normal pullback can happen when traders take profit or when buyers become less aggressive. In that case, price falls because demand softens or sellers use strength to exit.
A liquidation flush is different. It happens when leveraged positions are forced out of the market. Once that process begins, price can move quickly because selling is no longer fully discretionary. Traders are not choosing to exit calmly. They are being pushed out by margin pressure, position limits, and thin liquidity.
That forced selling pushed Bitcoin into a more important test: whether the 200-week SMA still acts as a cycle support level or becomes a structural warning.
The 200-week SMA matters because it smooths out short-term noise and reflects Bitcoin’s broader trend over several years. Short-term moving averages can break during routine volatility, but the 200-week SMA carries a different meaning because it sits closer to the market’s long-cycle foundation.
It also becomes psychological. When price reaches this level, traders are not just asking whether BTC can bounce. They are asking whether long-term buyers still see value there.
If buyers absorb pressure near the 200-week SMA, the level can act as structural support again. If demand weakens at that zone, the decline starts to look less like a forced reset and more like a deeper warning about market confidence. That is why signs of Bitcoin demand weakness matter here, because the 200-week SMA can only hold if real buyers are willing to support the level after forced selling.
Markets do not recover because selling pauses. They recover when buyers defend the structure that selling was supposed to break.
Long Liquidations Show How Crowded the Bullish Trade Had Become
The liquidation data shows how aggressively traders were positioned before the drop. More than $600 million in Bitcoin long positions were wiped out as BTC moved sharply lower, revealing how crowded bullish exposure had become.
That matters because crowded long positioning can make Bitcoin vulnerable even when the broader narrative remains positive. This also connects with recent caution in Bitcoin funding rates, where futures positioning has shown that leverage can still shape short-term market risk.
When too many traders are positioned in the same direction, the market becomes fragile. A sharp move lower can trigger stop-losses, margin calls, and forced liquidations. This creates a feedback loop where falling price causes more selling, and more selling pushes price into deeper liquidity zones.
The mechanism is simple. When many leveraged traders are forced to exit near the same levels, available buy orders can be absorbed quickly. If fresh demand is not waiting below, price has to move lower to find the next serious buyer.
That does not automatically mean Bitcoin has entered a deeper bearish phase. But it does explain why the 200-week SMA now matters more than the liquidation number itself.
A liquidation event can remove excess leverage. The larger question is whether the market still has enough demand at the long-term trend zone to turn that event into support rather than stress.
This is where the distinction between a structural rebound and a weak bounce becomes important.
A structural rebound would show buyers defending the 200-week SMA, absorbing pressure, and building steadier follow-through. A weaker bounce would show price reacting after liquidations, pulling short-term buyers back in, and then fading once relief demand slows.
The next few sessions matter because they will show whether Bitcoin’s reaction near the 200-week SMA has real participation behind it.
A market becomes stronger when weak positions are removed and longer-term buyers step in. It becomes weaker when leverage is cleared and demand still fails to appear.
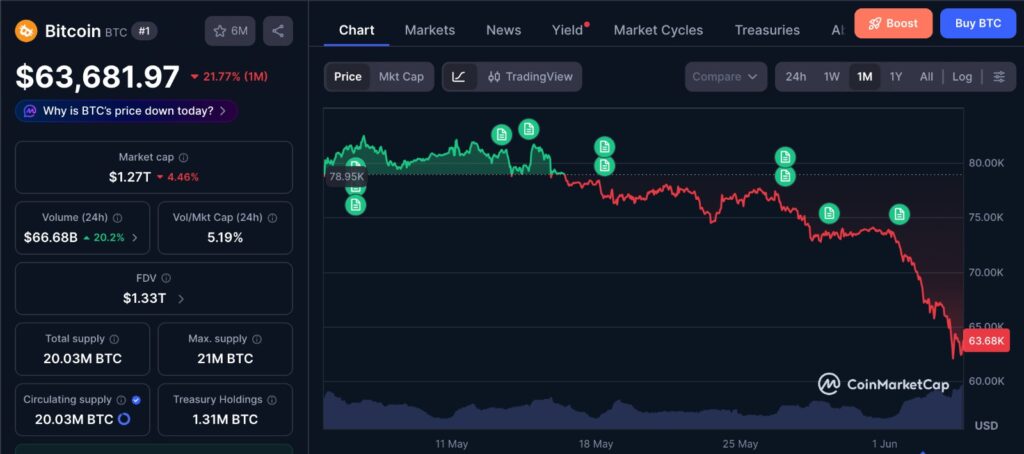
The 1-month Bitcoin chart shows how BTC reacted after the liquidation flush and whether price is beginning to stabilize near the 200-week SMA zone. The key point is not the size of the rebound, but whether Bitcoin can hold above this long-term support area after forced selling has cleared. A weak reaction would suggest buyers remain cautious, while a stronger hold would support the idea that the 200-week SMA is still acting as cycle-level support.
Why the $70K Area Still Matters
The immediate upside level traders are watching is the $69,000 to $70,000 area. But that zone is secondary to the 200-week SMA test.
The $69,000 to $70,000 region matters only after Bitcoin proves it can stay above the 200-week SMA. This makes the recent Bitcoin $70K support test useful context, but only as a secondary level after the long-term trend zone has been defended. Until then, the market is still testing support, not confirming recovery.
Bitcoin can bounce toward resistance and still remain vulnerable if the move is driven only by relief buying. For the rebound to carry more weight, BTC first needs to show that buyers are willing to defend the long-term trend zone.
That gives the market two clear tests.
The first test is defense. Bitcoin needs to stay above the 200-week SMA. The second test is continuation. BTC needs to reclaim higher levels without immediately losing momentum.
That is why a move toward $70,000 would not automatically confirm strength. It would become more meaningful only if Bitcoin reaches that area after defending the 200-week SMA with real demand, not just a short-term reaction.
Bear Flag Risk Has Not Disappeared
The bearish risk is still present because Bitcoin’s broader chart structure has not fully repaired. Some traders continue to watch for a deeper move if BTC fails to reclaim important resistance levels and loses the long-term trend area.
This is where the 200-week SMA becomes the dividing line.
As long as Bitcoin remains above that level, the bearish case is not fully confirmed. The market can still argue that BTC is testing a major cycle support zone after forced selling.
However, a clean break below the 200-week SMA would strengthen the bearish argument. It would suggest that buyers were unable to defend one of the most watched long-term levels even after leverage had already been reduced.
That would put deeper downside zones back into focus and make the recent rebound look more like a temporary reaction than a durable recovery.
For now, the market is not dealing with a confirmed breakdown or a confirmed recovery. It is dealing with a cycle-level decision point.
Bitcoin Needs More Than a Bounce
The most important signal now is not whether Bitcoin can produce a green candle after a liquidation flush. Markets often bounce after aggressive selling because leverage gets cleared and short-term traders react near obvious levels.
The real signal is whether Bitcoin can hold the 200-week SMA after that first reaction.
If buyers defend the level and BTC begins to stabilize above it, the decline may look like a severe but contained test of cycle structure. It would show that long-term support remained intact despite forced selling.
If Bitcoin loses the level, the market may start treating the move as something more serious. In that case, the liquidation event would not be viewed as the main story. The loss of long-term structure would be.
That is why the current Bitcoin setup cannot be judged by the size of the rebound alone.
The 200-week SMA is now the real line in the sand. Above it, bulls can argue that the cycle structure is still alive. Below it, the market may start questioning whether the latest decline has moved beyond forced selling and into structural weakness.
Price does not recover because a major level appears on a chart. It recovers when that level absorbs pressure and real demand is still willing to stand there.
Disclaimer: This content is for informational purposes only and does not constitute financial advice.
Keep yourself updated with the latest crypto news with FYI Gazette
 Bitcoin
  Ethereum
  Tether
  BNB
BNB  XRP
XRP  Solana
  TRON
TRON  Dogecoin
  Litecoin
  Pepe
Pepe