

Bitcoin Tests $60K as Oil Shock, Strategy Sale Fears Add Sell Pressure
Bitcoin is back near the $60,000 support area, but this is not just another chart retest. The latest move has become a broader pressure test for whether BTC can absorb several forms of selling at the same time.
The pullback comes as traders deal with macro stress, Strategy-related supply concerns, weaker crypto-specific demand, and renewed regulatory uncertainty. Each factor matters on its own. Together, they are testing whether Bitcoin’s market structure can hold while risk appetite weakens.
Bitcoin traded lower after failing to build a stronger recovery above the mid-$60,000 range. That failure matters because BTC did not only fall with broader risk assets. It also struggled to rebound when parts of the equity market attempted to stabilize.
That difference is important. When Bitcoin falls with stocks but does not recover with them, the market is usually dealing with more than a simple macro-driven move.
Bitcoin $60K Support Faces A Bigger Test
The $60,000 area is now acting as a key line for traders because it sits near an important psychological and technical zone. It also follows the earlier Bitcoin liquidation reset near $60K support, which made this area important for both positioning and buyer absorption. A clean defense would show that buyers are still willing to absorb stress. A deeper break below it would raise the risk that the market is moving from a controlled pullback into a wider confidence reset.
The current test is different from a normal support retest because selling pressure is coming from several directions at once.
Oil prices have moved higher as geopolitical tensions increased, adding pressure to inflation expectations. Higher energy prices can make it harder for markets to price in easier monetary policy, especially if traders believe inflation risks are returning. That matters for Bitcoin because BTC still trades like a liquidity-sensitive asset during periods of stress.
When markets expect tighter financial conditions, speculative demand usually weakens first. Traders become less willing to chase upside, leverage gets reduced, and buyers often wait for lower prices instead of absorbing supply immediately.
This matters because support levels only hold when real demand meets supply before sellers gain control. Bitcoin does not need perfect macro conditions to defend $60,000. It needs enough buyers willing to act while the market is still uncertain.
That is the mechanism behind the pressure test: when macro stress, supply fears, and weak demand arrive together, buyers have to absorb more than one source of selling before the market can stabilize.
CMC Chart Analysis
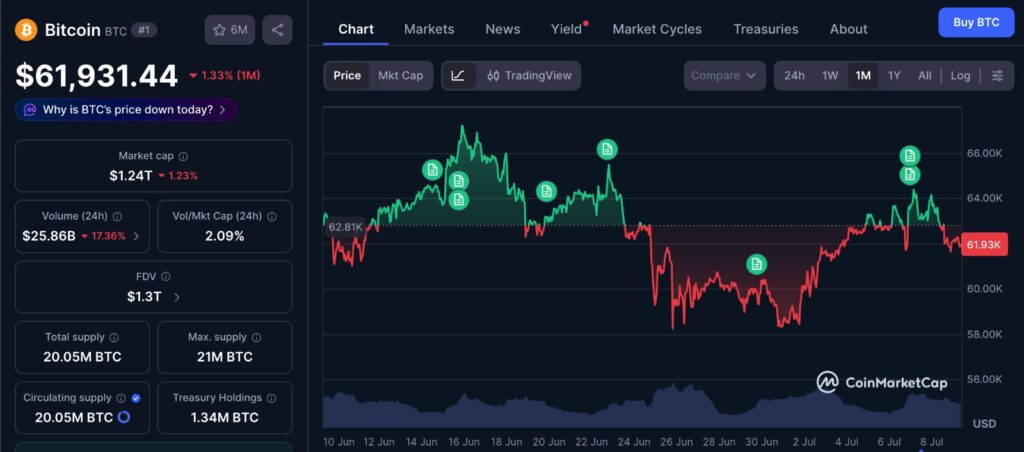
The 1-month Bitcoin chart shows BTC moving back toward the $60,000 support area after failing to hold a stronger recovery above the mid-$60,000 range. This makes the current retest important because the pressure is not coming from one direction alone. Oil-driven macro stress, Strategy sale concerns, and weaker demand are all arriving near the same level, which means buyers need to absorb more than a normal pullback. A stronger hold would suggest that buyers are still defending the range, while a weak reaction would show that the market may need to search for lower liquidity.
Oil Shock Adds Pressure To Risk Assets
The oil move has become one of the biggest external risks for Bitcoin in the short term. Rising crude prices can feed into inflation expectations, reduce confidence in rate cuts, and push investors away from assets that rely heavily on liquidity.
For Bitcoin, the problem is not simply that oil is rising. The problem is what higher oil prices signal to investors. That same pressure was visible in the earlier Bitcoin price drop below $75K as oil and Hormuz risk increased, where energy-market stress became a direct risk-appetite problem for BTC.
If energy prices stay elevated, markets may begin pricing in a longer period of restrictive policy. That makes it harder for risk assets to sustain rallies based on hopes of easier financial conditions. It also reduces the room for traders to chase momentum aggressively.
This is where Bitcoin’s $60,000 test becomes more serious. A normal pullback can be absorbed when liquidity expectations remain supportive. A pullback during an oil shock requires stronger conviction from spot buyers.
Markets do not usually break because one headline appears. They break when buyers step back at the same time sellers become more urgent.
Recent sessions have shown that BTC buyers are still present, but not aggressive enough to fully cancel out the pressure from macro uncertainty and crypto-specific concerns.
Strategy Sale Fears Add A Second Layer
The pressure is not only macro-driven. Concerns around Strategy have added another layer to Bitcoin’s short-term weakness.
Strategy’s reported $216 million Bitcoin sale has created anxiety because the company has long been viewed as one of the strongest symbols of corporate Bitcoin conviction. When a holder with that level of visibility sells BTC, the market does not only react to the size of the sale. It reacts to the signal.
The direct sale amount may be manageable for Bitcoin’s overall market, but the bigger issue is whether traders begin to price in the possibility of future selling. This is why the earlier discussion around Strategy Bitcoin sale market risk matters here, because the market is reacting less to one transaction and more to the confidence signal behind it.
That distinction matters because markets adjust before the supply actually appears. Once traders believe more selling could follow, buyers may become more patient and sellers may become more willing to test the order book.
This is why the Strategy story is weighing on sentiment. Traders are not just asking whether Bitcoin can absorb one sale. They are asking whether BTC can absorb recurring supply if corporate balance-sheet pressure becomes a bigger theme.
That changes participant behavior. Buyers who may have stepped in quickly near support can wait for confirmation before taking risk. Short-term traders may reduce exposure. Sellers may test bids because they believe the market is dealing with a larger supply question.
Bitcoin’s reaction around $60,000 will show whether the market sees the sale as isolated supply or the start of a wider confidence issue.
Weak Demand Makes The Support Test Harder
Bitcoin’s inability to quickly recover from the low-$60,000 area suggests that demand is not strong enough yet to overwhelm the sell pressure. That demand gap also connects with the broader Bitcoin bull run demand lags analysis, where the key issue was whether BTC still had enough fresh buying to support higher prices.
That does not mean the bull case is broken. It means the market is no longer giving Bitcoin the benefit of the doubt.
During stronger phases, buyers step in quickly on dips because they fear missing the next leg higher. During weaker phases, buyers wait for confirmation. That change in behavior can make support levels more fragile, even when the long-term narrative remains intact.
The key question is whether this pullback attracts real spot accumulation or only short-term futures-driven rebounds. A futures-led bounce can move price quickly, but it often fades if spot buyers do not follow.
In a weaker demand environment, support becomes less about the number itself and more about execution. The market needs to see whether bids are deep enough, whether sellers slow down near the level, and whether rebounds are supported by real buying rather than temporary positioning resets.
Liquidity is not continuous. Once nearby orders are absorbed, price often has to move lower to find the next area where buyers are willing to step in.
Leverage also matters here. When traders are already cautious, they often reduce exposure instead of adding risk, which can make rebounds smaller and support tests last longer. That is why Bitcoin funding rates and cautious leverage remain important, because weaker positioning can limit how quickly buyers respond during a support test.
That is why the $60,000 area remains important. If buyers defend it with strong absorption, Bitcoin can stabilize and rebuild structure. If the reaction stays weak, sellers may continue testing lower liquidity zones.
Regulatory Uncertainty Returns To The Background
Regulatory concerns are also returning at a difficult time for the market. Recent reports suggested that Indian authorities remain cautious toward crypto exposure, adding to the sense that global oversight risk has not disappeared.
This does not mean one regulatory development will decide Bitcoin’s trend. Bitcoin has already survived years of policy uncertainty across different markets. However, regulation can reduce dip-buying appetite when the market is already fragile.
The timing is what matters.
When BTC is rising strongly, regulatory headlines are often absorbed quickly. When BTC is sitting near major support, those same headlines can make traders more cautious. In this case, regulation is not the reason Bitcoin is testing $60,000, but it is another background weight on a market already dealing with oil stress, Strategy sale fears, and weaker demand.
What Bitcoin Needs To Show Next
Bitcoin now needs to prove that the $60,000 area is more than a line on the chart.
A strong defense would require buyers to absorb selling without relying only on short squeezes or temporary relief rallies. Ideally, BTC would need to reclaim higher levels with stronger volume and show that sellers are losing control near support.
If Bitcoin holds $60,000 and begins to recover while oil pressure remains elevated, that would carry more weight than a bounce caused only by calmer macro headlines. It would suggest that buyers are willing to step in even when conditions are not easy.
If Bitcoin breaks below $60,000 with weak demand, the market could begin treating the move as a broader risk-off signal rather than a simple support retest.
Bitcoin is not only testing a price level. It is testing whether its demand base can absorb multiple sources of pressure at once.
For now, the $60,000 zone remains the line traders are watching. Holding it would keep the market structure intact. Losing it would show that sellers are finding less resistance each time they test the market.
Support does not hold because traders are watching it. It holds when buyers absorb enough supply to stop the market from searching lower, and this $60,000 test will show whether sellers still control the next move or whether buyers can finally slow the pressure.
Disclaimer: This content is for informational purposes only and does not constitute financial advice.
 Bitcoin
  Ethereum
  Tether
  BNB
BNB  XRP
XRP  Solana
  TRON
TRON  Dogecoin
  Litecoin
  Pepe
Pepe